How do CO2 emissions compare when we adjust for trade?
Which countries are net importers and exports of emissions? How much CO2 is ‘offshored’?
CO2 emissions are typically measured on the basis of ‘production’. This accounting method – which is sometimes referred to as ‘territorial’ emissions – is used when countries report their emissions, and set targets domestically and internationally.1
In addition to the commonly reported territorial emissions statisticians also calculate ‘consumption-based’ emissions. These emissions are adjusted for trade. To calculate consumption-based emissions we need to track which goods are traded across the world, and whenever a good was imported we need to include all CO2 emissions that were emitted in the production of that good, and vice versa to subtract all CO2 emissions that were emitted in the production of goods that were exported.
Consumption-based emissions reflect the consumption and lifestyle choices of a country’s citizens.
Which countries in the world are net importers of emissions and which are net exporters?
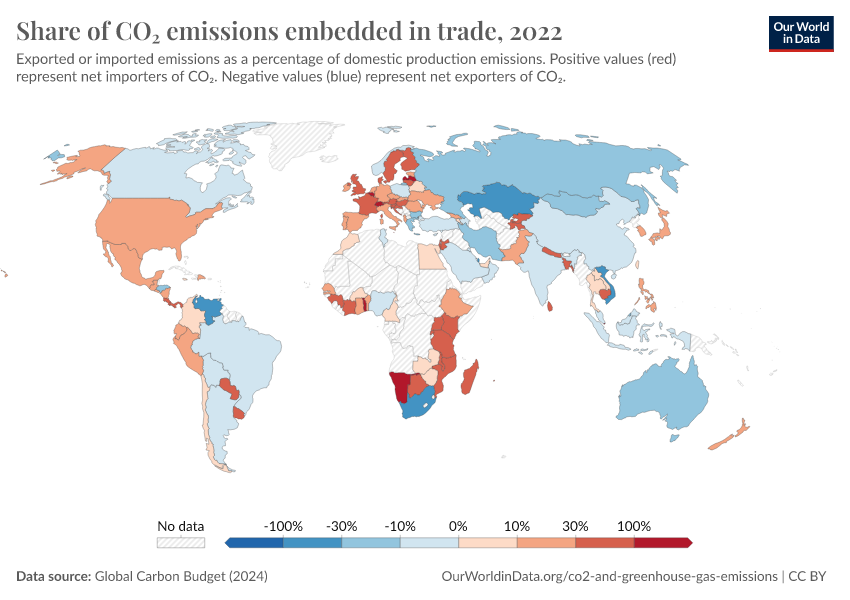
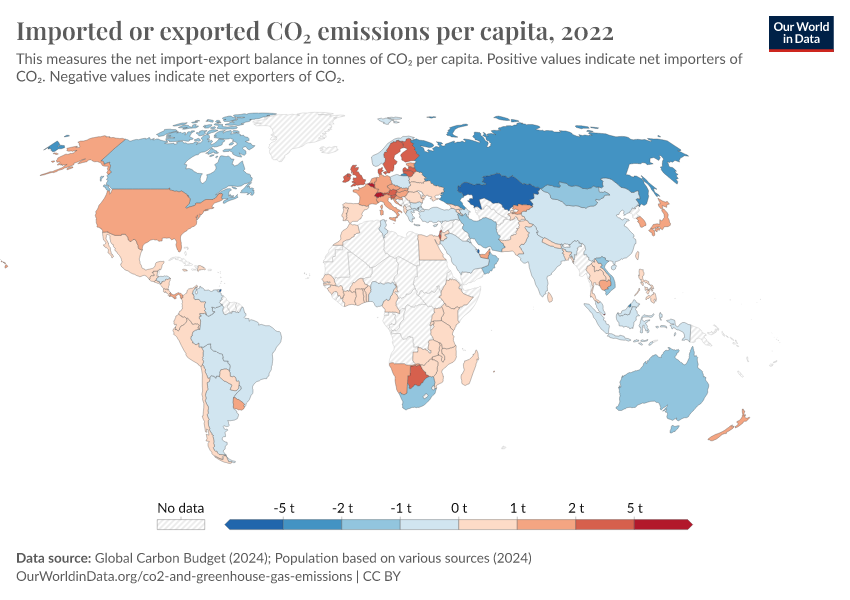
In the interactive map we see the emissions of traded goods. To give a perspective on the importance of trade these emissions are put in relation to the country’s domestic, territorial.2
- Countries shown in red are net importers of emissions – they import more CO2 embedded in goods than they export.
- Countries shown in blue are net exporters of emissions – they export more CO2 embedded in goods than they import.
We see quite a regional East-West split in net exporters and importers: most of Western Europe, the Americas, and many African countries are net importers of emissions whilst most of Eastern Europe and Asia are net exporters.
You can find these figures in absolute (tonnes of CO2) and per capita terms for each country later in this article.
How do consumption-based emissions compare to territorial emissions?
How did the differences between a country’s territorial and consumption-based emissions change over time?
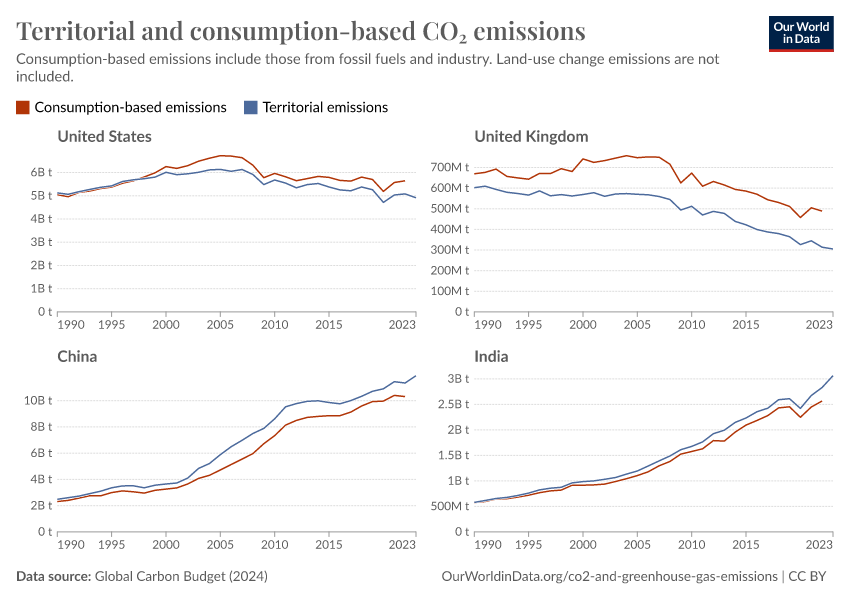
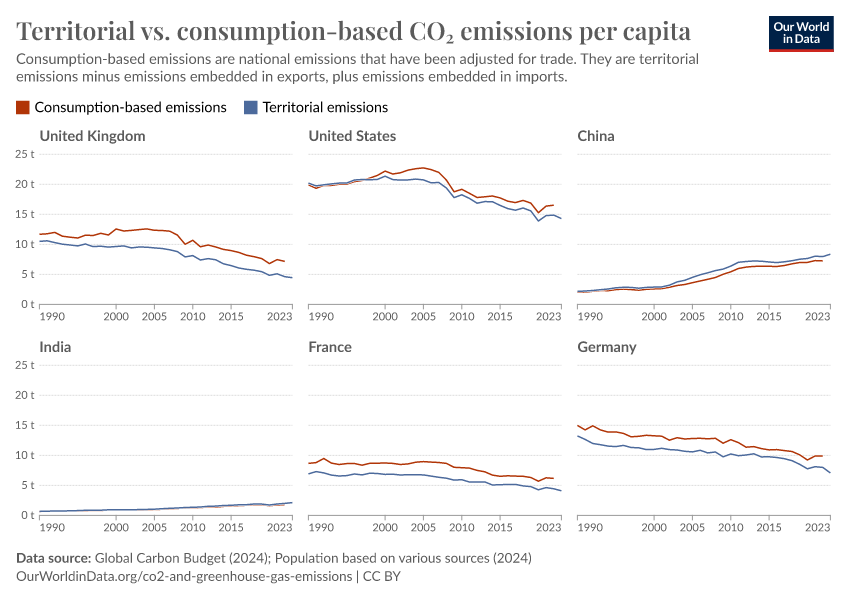
In the interactive charts you can compare territorial and consumption-based emissions for many countries and world regions since the first data is available in 1990.3 One chart shows total annual emissions, the other one shows the same on a per capita basis.
These comparisons provide the answer to the question whether countries have only achieved emissions reductions by offshoring emissions intensive production to other countries. If only territorial emissions were falling whilst consumption-based emissions were rising, this would suggest it was ‘offshoring’ emissions elsewhere.
In most countries emissions increased when countries become richer, but this is also not necessarily the case: by comparing the change in consumption-based emissions and economic growth we see that many countries have become much richer while achieving a reduction of emissions.
In-depth: how much emissions are embedded in trade?
Absolute emissions imported or exported by country
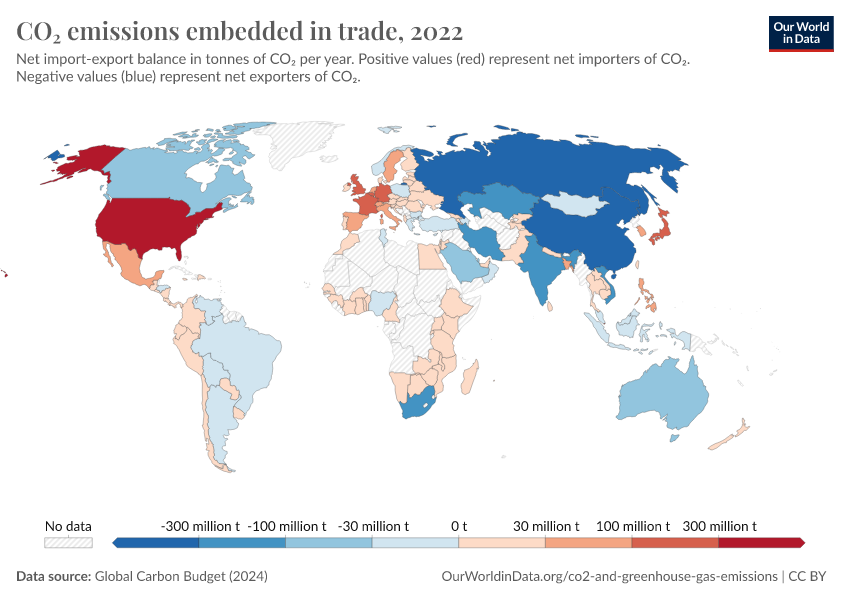
In the interactive map you see each country’s net imports or exports of CO2 each year, as measured in tonnes of CO2.
Countries which are net importers are shown in red (and given as positive values), with net exporters shown in blue (given as negative values).
Per capita emissions imported or exported by country
In the interactive map you see each country’s net imports or exports of CO2per capita, measured in tonnes of CO2 per person per year.
Countries which are net importers are shown in red (and given as positive values), with net exporters shown in blue (given as negative values).
Consumption-based CO2 emissions by country
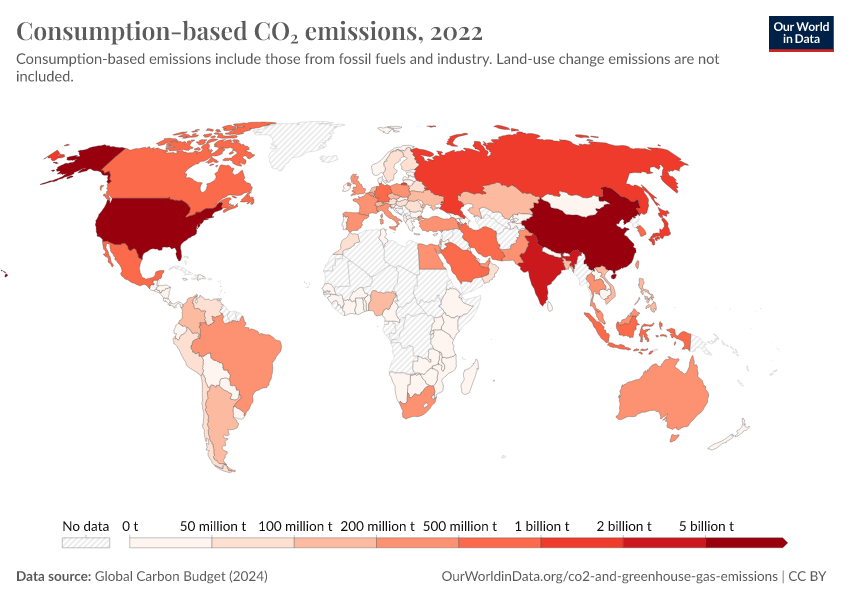
In the interactive map we see how consumption-based CO2 emissions vary across the world.
Consumption-based CO2 emissions per capita
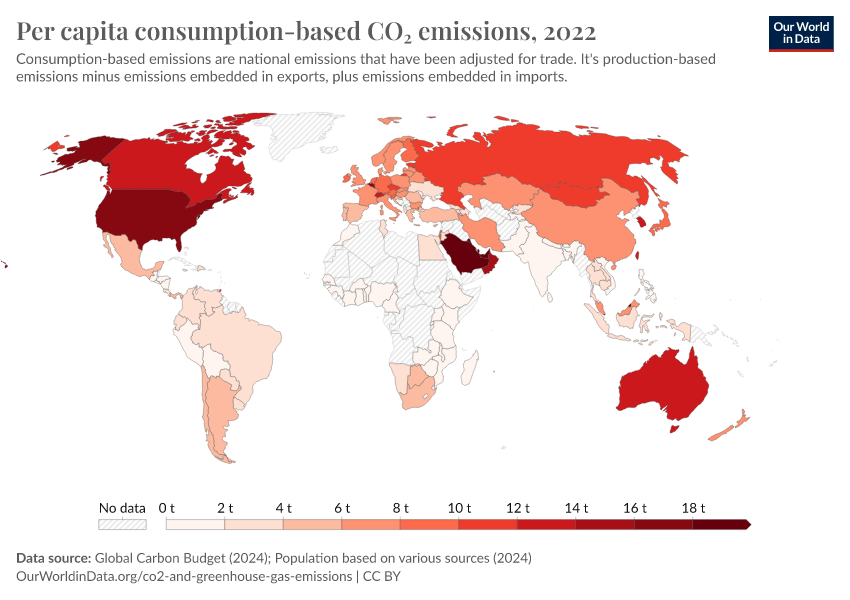
In the visualization we show how consumption-based emissions corrected for population size – emissions per capita – varies across the world.
Endnotes
The Intergovernmental Panel for Climate Change (IPCC) guidelines on national emissions accounting and reporting are written on the basis of territorial, rather than consumption-based emissions. These are the standards adopted internationally for emissions reporting.
Eggleston, S., Buendia, L., Miwa, K., Ngara, T., & Tanabe, K. (Eds.). (2006). 2006 IPCC guidelines for national greenhouse gas inventories (Vol. 5). Hayama, Japan: Institute for Global Environmental Strategies.
These figures have been calculated by Our World in Data based on data on consumption-based emissions and emissions transfers published by the updated work of Peters et al. (2012) and the Global Carbon Project (referenced below). To calculate net emissions transfers, the authors look at the difference between CO2 embedded in imported and exported goods: the net transfers is the difference between the two.
Data is sourced from the Global Carbon Budget (2018): https://www.globalcarbonproject.org/carbonbudget/18/data.htm. This presents territorial emissions data in addition to consumption-based and emissions transfers. Consumption-based and emissions transfer estimates are produced by the updated paper by Peters et al. (2011).
(Updated to 2014) Peters, GP, Minx, JC, Weber, CL and Edenhofer, O 2011. Growth in emission transfers via international trade from 1990 to 2008. Proceedings of the National Academy of Sciences 108, 8903-8908. Available online.
Data is only available for 119 countries. It is not available for the remaining countries due to poor data availability on bilateral trade, and emissions inventories broken down by specific sectors – this data is essential for the input-output modelling process used to calculate consumption-based emissions. For more information, see: Peters, GP, Minx, JC, Weber, CL and Edenhofer, O 2011 (updated). Growth in emission transfers via international trade from 1990 to 2008. Proceedings of the National Academy of Sciences 108, 8903-8908.
Cite this work
Our articles and data visualizations rely on work from many different people and organizations. When citing this article, please also cite the underlying data sources. This article can be cited as:
Hannah Ritchie (2019) - “How do CO2 emissions compare when we adjust for trade?” Published online at OurWorldinData.org. Retrieved from: 'https://ourworldindata.org/consumption-based-co2' [Online Resource]BibTeX citation
@article{owid-consumption-based-co2,
    author = {Hannah Ritchie},
    title = {How do CO2 emissions compare when we adjust for trade?},
    journal = {Our World in Data},
    year = {2019},
    note = {https://ourworldindata.org/consumption-based-co2}
}
Reuse this work freely
All visualizations, data, and code produced by Our World in Data are completely open access under the Creative Commons BY license. You have the permission to use, distribute, and reproduce these in any medium, provided the source and authors are credited.
The data produced by third parties and made available by Our World in Data is subject to the license terms from the original third-party authors. We will always indicate the original source of the data in our documentation, so you should always check the license of any such third-party data before use and redistribution.
All of our charts can be embedded in any site.
