Coronavirus (COVID-19) Hospitalizations
On this page, we present data on hospitalization and intensive care (ICU) admissions due to coronavirus (COVID-19).
Our hospital & ICU data has been collected from official sources and collated by Our World in Data. Many countries have stopped reporting hospitalization data, creating gaps in the data displayed on the charts.
The complete list of country-by-country sources is available on GitHub.
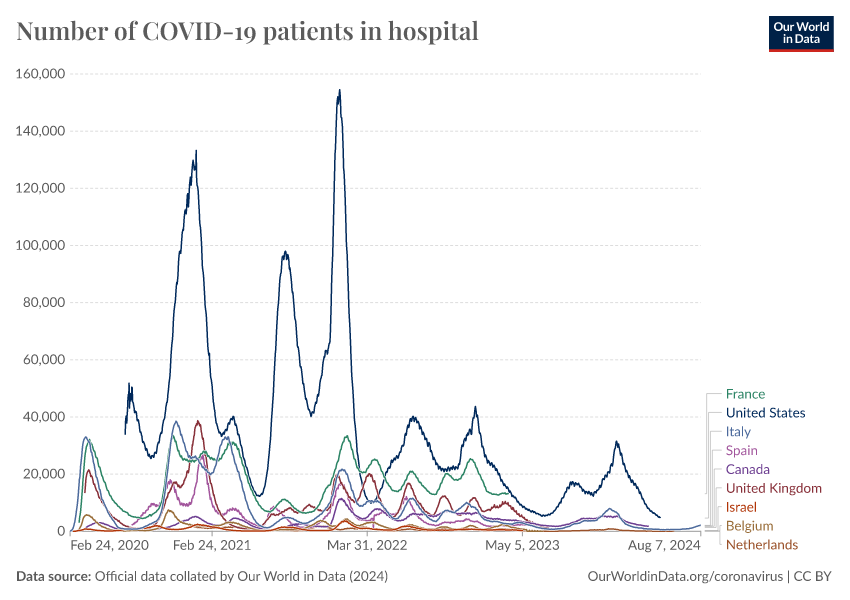
COVID-19 hospitalizations
How many people are in hospitals due to COVID-19 at a given time?
This chart shows the total number of patients in hospitals due to Coronavirus (COVID-19) at a given time.
This is different from the number of patients newly admitted to hospitals due to COVID-19, which you will find in the next section.
Related chart:
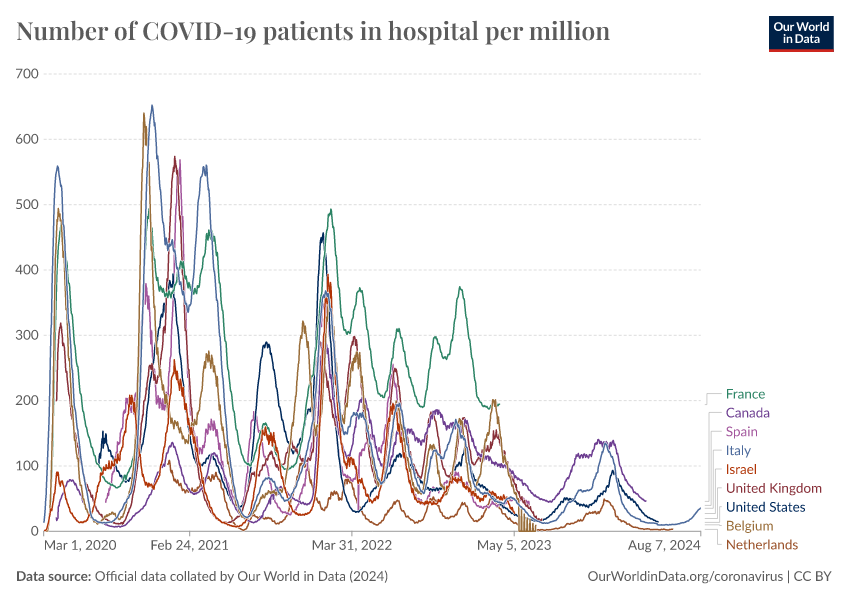
Number of COVID-19 patients in hospital per million
How do COVID-19 hospitalizations compare when we adjust for population?
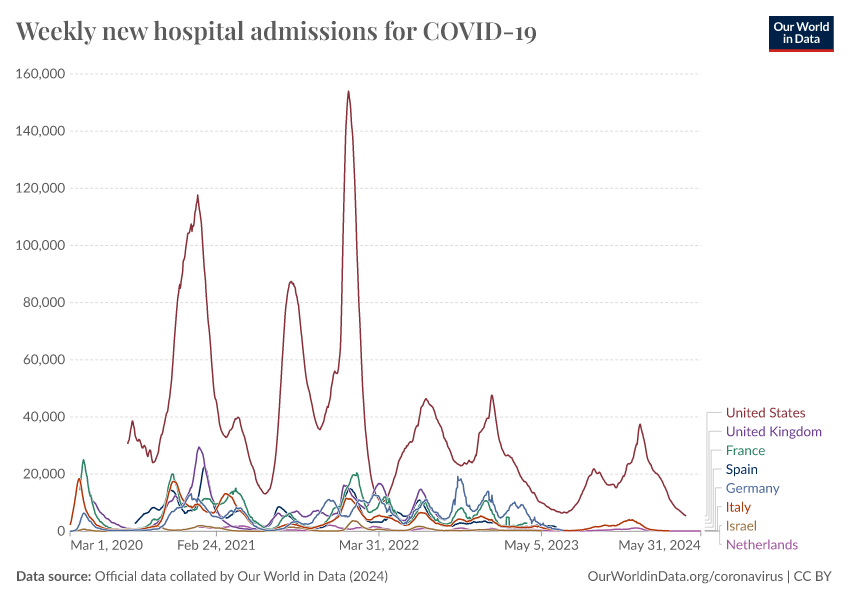
What is the weekly number of new hospitalizations due to COVID-19?
This chart shows the weekly number of new hospitalizations due to COVID-19.
Note that this number is different from the total number of patients in hospital due to COVID-19 at a given time. You can find this data in the previous section.
Three tips on how to interact with this chart
- By clicking on ‘Edit countries and regions’, you can show and compare the data for any country in the world you are interested in.
- If you click on the title of the chart, the chart will open in a new tab. You can then copy-paste the URL and share it.
- Map view: switch to a global map of weekly hospitalizations by clicking the ‘Map’ button at the top of the chart.
Related charts:
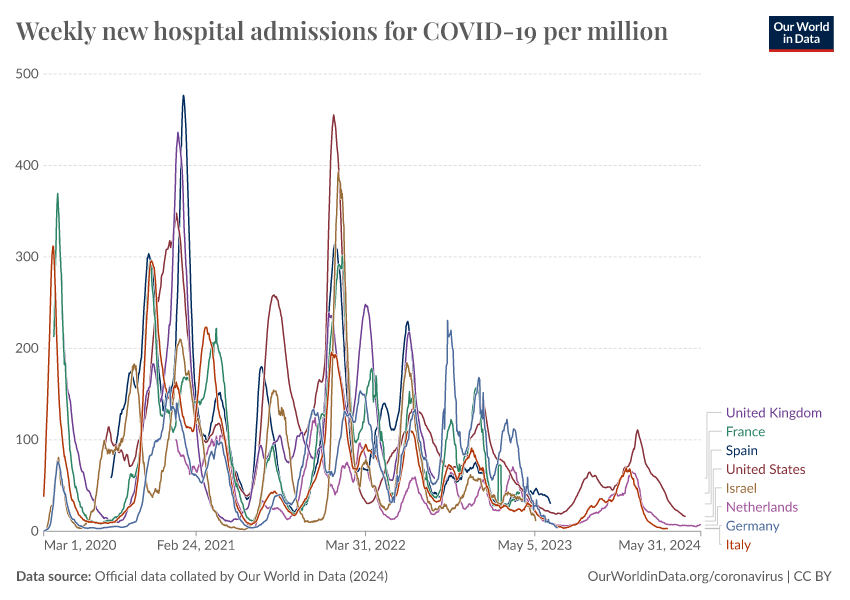
Weekly new COVID-19 hospitalizations per million
How do weekly new COVID-19 hospitalizations compare when we adjust for population?
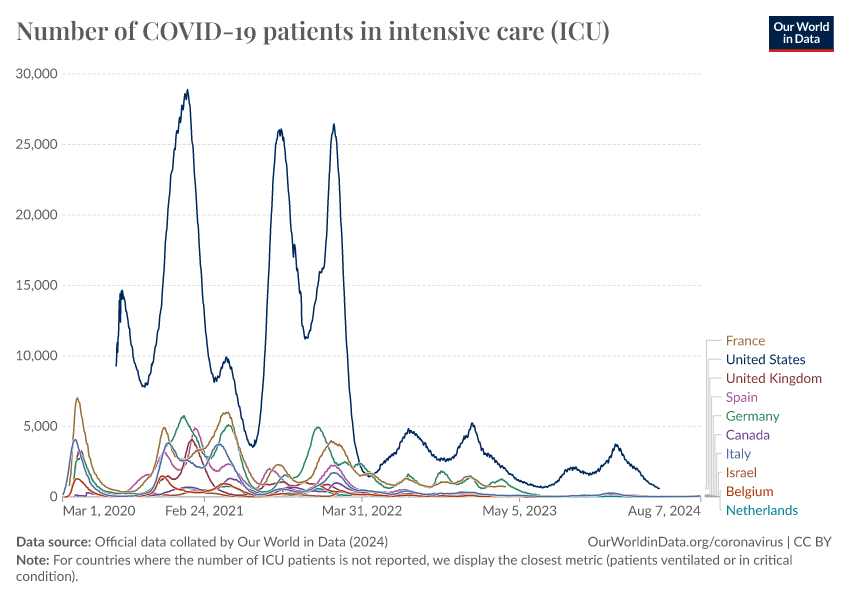
Intensive care (ICU) admissions due to COVID-19
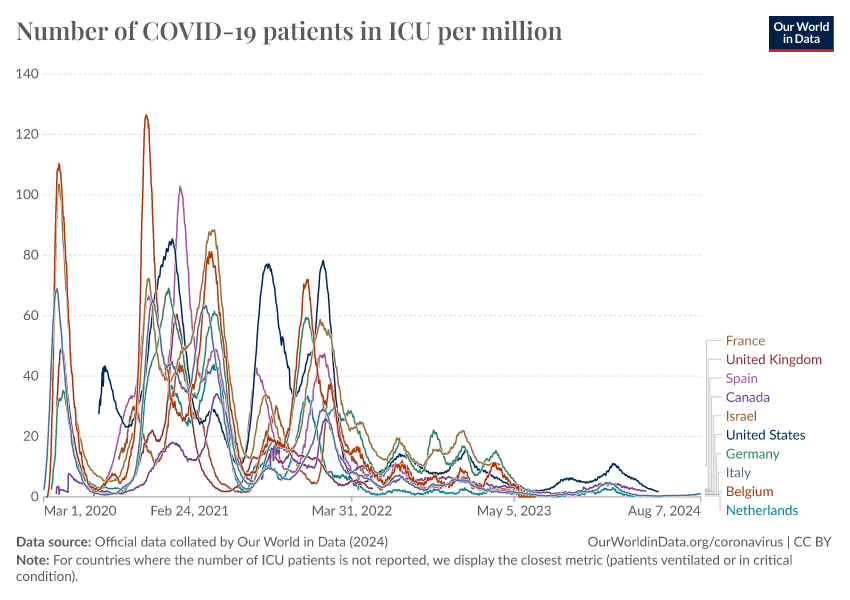
How many people are in intensive care (ICU) due to COVID-19 at a given time?
This chart shows the total number of patients in intensive care units (ICU) due to COVID-19 at a given time, as a rate per million people.
Note that this is different from the weekly number of people newly admitted to ICU due to COVID-19. You can find this metric in the next section.
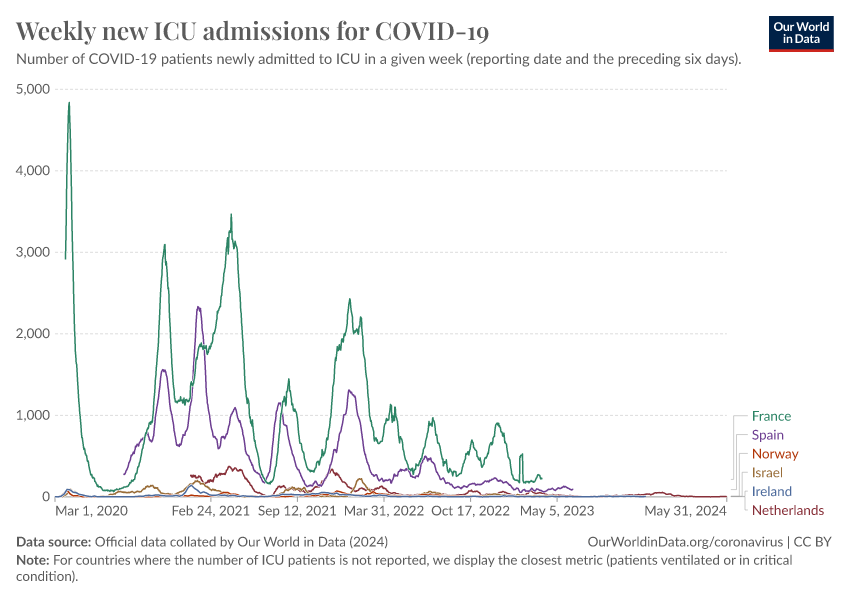
What is the weekly number of new admissions to ICU due to COVID-19?
This chart shows the weekly number of new admissions to intensive care units (ICU) due to COVID-19.
Note that this number is different from the total number of patients in ICU due to COVID-19 at any given time. You can find this data in the previous section.
Related chart:
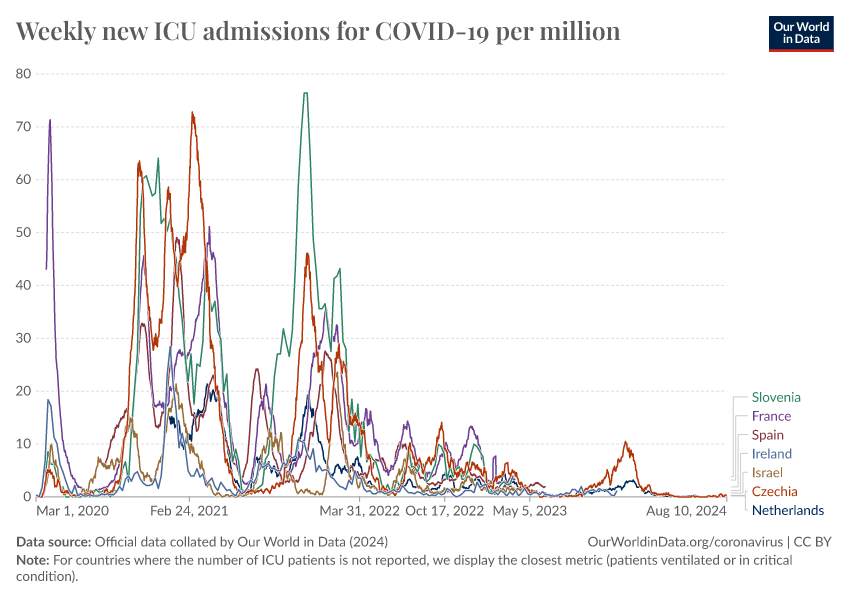
Weekly new COVID-19 ICU admissions per million
How do weekly new ICU admissions for COVID-19 compare when we adjust for population?
Our work belongs to everyone
Download the complete Our World in Data COVID-19 dataset
- All our code is open-source
- All our research and visualizations are free for everyone to use for all purposes
Cite this work
Our articles and data visualizations rely on work from many different people and organizations. When citing this article, please also cite the underlying data sources. This article can be cited as:
Edouard Mathieu, Hannah Ritchie, Lucas Rodés-Guirao, Cameron Appel, Daniel Gavrilov, Charlie Giattino, Joe Hasell, Bobbie Macdonald, Saloni Dattani, Diana Beltekian, Esteban Ortiz-Ospina, and Max Roser (2020) - “Coronavirus (COVID-19) Hospitalizations” Published online at OurWorldinData.org. Retrieved from: 'https://ourworldindata.org/covid-hospitalizations' [Online Resource]BibTeX citation
@article{owid-covid-hospitalizations,
    author = {Edouard Mathieu and Hannah Ritchie and Lucas Rodés-Guirao and Cameron Appel and Daniel Gavrilov and Charlie Giattino and Joe Hasell and Bobbie Macdonald and Saloni Dattani and Diana Beltekian and Esteban Ortiz-Ospina and Max Roser},
    title = {Coronavirus (COVID-19) Hospitalizations},
    journal = {Our World in Data},
    year = {2020},
    note = {https://ourworldindata.org/covid-hospitalizations}
}
Reuse this work freely
All visualizations, data, and code produced by Our World in Data are completely open access under the Creative Commons BY license. You have the permission to use, distribute, and reproduce these in any medium, provided the source and authors are credited.
The data produced by third parties and made available by Our World in Data is subject to the license terms from the original third-party authors. We will always indicate the original source of the data in our documentation, so you should always check the license of any such third-party data before use and redistribution.
All of our charts can be embedded in any site.
