Data

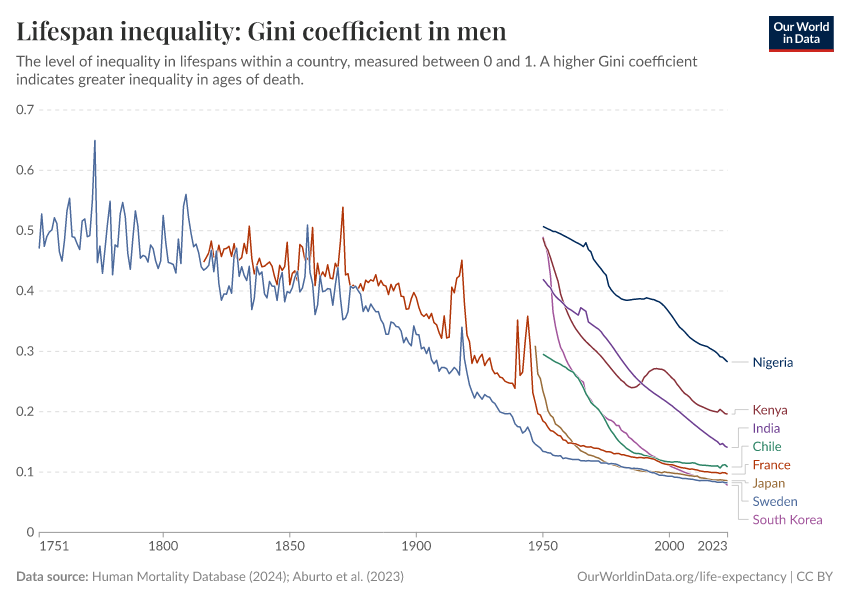
Lifespan inequality: Gini coefficient in men
See all data and research on:

What you should know about this indicator

  • The level of inequality in lifespans, measured between 0 and 1.
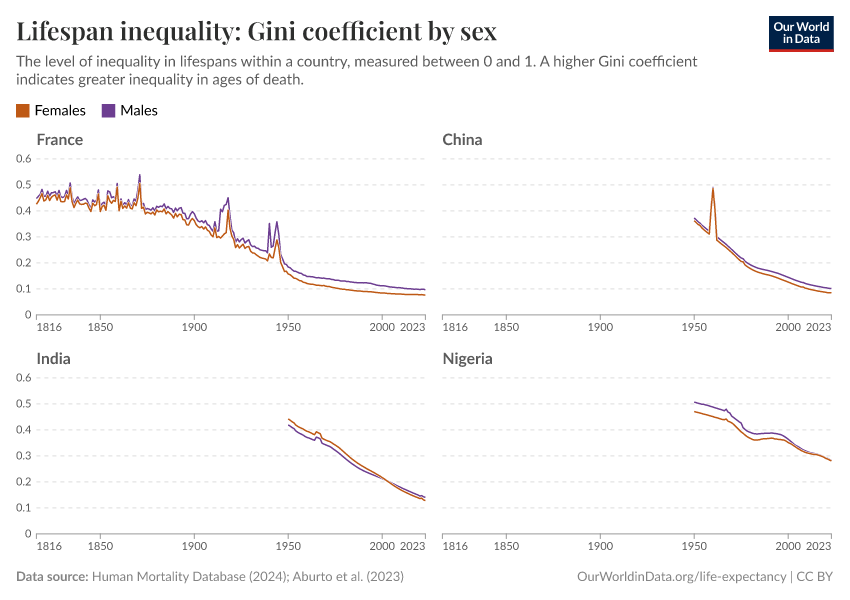
  • A higher coefficient indicates greater inequality in ages of death, while a lower coefficient indicates more uniform ages of death.
Lifespan inequality: Gini coefficient in men
The level of inequality in lifespans, measured between 0 and 1.
Source
Human Mortality Database (2024); Aburto et al. (2023) – with major processing by Our World in Data
Last updated
December 3, 2024
Next expected update
December 2025
Date range
1751–2023

Sources and processing

This data is based on the following sources

The Human Mortality Database (HMD) contains original calculations of all-cause death rates and life tables for national populations (countries or areas), as well as the input data used in constructing those tables. The input data consist of death counts from vital statistics, plus census counts, birth counts, and population estimates from various sources.

Scope and basic principles

The database is limited by design to populations where death registration and census data are virtually complete, since this type of information is required for the uniform method used to reconstruct historical data series. As a result, the countries and areas included here are relatively wealthy and for the most part highly industrialized.

The main goal of the Human Mortality Database is to document the longevity revolution of the modern era and to facilitate research into its causes and consequences. As much as possible, the authors of the database have followed four guiding principles: comparability, flexibility, accessibility, reproducibility.

Computing death rates and life tables

Their process for computing mortality rates and life tables can be described in terms of six steps, corresponding to six data types that are available from the HMD. Here is an overview of the process:

  1. Births. Annual counts of live births by sex are collected for each population over the longest possible time period. These counts are used mainly for making population estimates at younger ages.
  2. Deaths. Death counts are collected at the finest level of detail available. If raw data are aggregated, uniform methods are used to estimate death counts by completed age (i.e., age-last-birthday at time of death), calendar year of death, and calendar year of birth.
  3. Population size. Annual estimates of population size on January 1st are either obtained from another source or are derived from census data plus birth and death counts.
  4. Exposure-to-risk. Estimates of the population exposed to the risk of death during some age-time interval are based on annual (January 1st) population estimates, with a small correction that reflects the timing of deaths within the interval.
  5. Death rates. Death rates are always a ratio of the death count for a given age-time interval divided by an estimate of the exposure-to-risk in the same interval.
  6. Life tables. To build a life table, probabilities of death are computed from death rates. These probabilities are used to construct life tables, which include life expectancies and other useful indicators of mortality and longevity.

Corrections to the data

The data presented here have been corrected for gross errors (e.g., a processing error whereby 3,800 becomes 38,000 in a published statistical table would be obvious in most cases, and it would be corrected). However, the authors have not attempted to correct the data for systematic age misstatement (misreporting of age) or coverage errors (over- or under-enumeration of people or events).

Some available studies assess the completeness of census coverage or death registration in the various countries, and more work is needed in this area. However, in developing the database thus far, the authors did not consider it feasible or desirable to attempt corrections of this sort, especially since it would be impossible to correct the data by a uniform method across all countries.

Age misreporting

Populations are included here if there is a well-founded belief that the coverage of their census and vital registration systems is relatively high, and thus, that fruitful analyses by both specialists and non-specialists should be possible with these data. Nevertheless, there is evidence of both age heaping (overreporting ages ending in "0" or "5") and age exaggeration in these data.

In general, the degree of age heaping in these data varies by the time period and population considered, but it is usually no burden to scientific analysis. In most cases, it is sufficient to analyze data in five-year age groups in order to avoid the false impressions created by this particular form of age misstatement.

Age exaggeration, on the other hand, is a more insidious problem. The authors' approach is guided by the conventional wisdom that age reporting in death registration systems is typically more reliable than in census counts or official population estimates. For this reason, the authors derive population estimates at older ages from the death counts themselves, employing extinct cohort methods. Such methods eliminate some, but certainly not all, of the biases in old-age mortality estimates due to age exaggeration.

Uniform set of procedures

A key goal of this project is to follow a uniform set of procedures for each population. This approach does not guarantee the cross-national comparability of the data. Rather, it ensures only that the authors have not introduced biases by the authors' own manipulations. The desire of the authors for uniformity had to face the challenge that raw data come in a variety of formats (for example, 1-year versus 5-year age groups). The authors' general approach to this problem is that the available raw data are used first to estimate two quantities: 1) the number of deaths by completed age, year of birth, and year of death; and 2) population estimates by single years of age on January 1 of each year. For each population, these calculations are performed separately by sex. From these two pieces of information, they compute death rates and life tables in a variety of age-time configurations.

It is reasonable to ask whether a single procedure is the best method for treating the data from a variety of populations. Here, two points must be considered. First, the authors' uniform methodology is based on procedures that were developed separately, though following similar principles, for various countries and by different researchers. Earlier methods were synthesized by choosing what they considered the best among alternative procedures and by eliminating superficial inconsistencies. The second point is that a uniform procedure is possible only because the authors have not attempted to correct the data for reporting and coverage errors. Although some general principles could be followed, such problems would have to be addressed individually for each population.

Although the authors adhere strictly to a uniform procedure, the data for each population also receive significant individualized attention. Each country or area is assigned to an individual researcher, who takes responsibility for assembling and checking the data for errors. In addition, the person assigned to each country/area checks the authors' data against other available sources. These procedures help to assure a high level of data quality, but assistance from database users in identifying problems is always appreciated!

Retrieved on
November 27, 2024
Citation
This is the citation of the original data obtained from the source, prior to any processing or adaptation by Our World in Data. To cite data downloaded from this page, please use the suggested citation given in Reuse This Work below.
HMD. Human Mortality Database. Max Planck Institute for Demographic Research (Germany), University of California, Berkeley (USA), and French Institute for Demographic Studies (France). Available at www.mortality.org.
See also the methods protocol:
Wilmoth, J. R., Andreev, K., Jdanov, D., Glei, D. A., Riffe, T., Boe, C., Bubenheim, M., Philipov, D., Shkolnikov, V., Vachon, P., Winant, C., & Barbieri, M. (2021). Methods protocol for the human mortality database (v6). Available online (needs log in to mortality.org).

The World Population Prospects 2024 is the 28th edition of the official estimates and projections of the global population published by the United Nations since 1951. The estimates are based on all available sources of data on population size and levels of fertility, mortality, and international migration for 237 countries or areas.

For each revision, any new, recent, and historical, information that has become available from population censuses, vital registration of births and deaths, and household surveys is considered to produce consistent time series of population estimates for each country or areas from 1950 to today

For the estimation period between 1950 and 2023, data from 1,910 censuses were considered in the present evaluation, which is 79 more than the 2022 revision. In some countries, population registers based on administrative data systems provide the necessary information. Population data from censuses or registers referring to 2019 or later were available for 114 countries or areas, representing 48 per cent of the 237 countries or areas included in this analysis (and 54 per cent of the world population). For 43 countries or areas, the most recent available population count was from the period 2014-2018, and for another 57 locations from the period 2009-2013. For the remaining 23 countries or areas, the most recent available census data were from before 2009, that is more than 15 years ago.

Retrieved on
December 2, 2024
Citation
This is the citation of the original data obtained from the source, prior to any processing or adaptation by Our World in Data. To cite data downloaded from this page, please use the suggested citation given in Reuse This Work below.
United Nations, Department of Economic and Social Affairs, Population Division (2024). World Population Prospects 2024, Online Edition.

How we process data at Our World in Data

All data and visualizations on Our World in Data rely on data sourced from one or several original data providers. Preparing this original data involves several processing steps. Depending on the data, this can include standardizing country names and world region definitions, converting units, calculating derived indicators such as per capita measures, as well as adding or adapting metadata such as the name or the description given to an indicator.

At the link below you can find a detailed description of the structure of our data pipeline, including links to all the code used to prepare data across Our World in Data.

Read about our data pipeline
Notes on our processing step for this indicator

This was calculated using the algorithm and scripts from Aburto et al. (2020). We regenerated the Gini coefficient, rather than the inverse-log Gini coefficient.

Citation: Aburto, J. M., Villavicencio, F., Basellini, U., Kjærgaard, S., & Vaupel, J. W. (2020). Dynamics of life expectancy and life span equality. Proceedings of the National Academy of Sciences, 117(10), 5250–5259. https://doi.org/10.1073/pnas.1915884117 Code available on Zenodo: https://zenodo.org/record/3571095

Reuse this work

  • All data produced by third-party providers and made available by Our World in Data are subject to the license terms from the original providers. Our work would not be possible without the data providers we rely on, so we ask you to always cite them appropriately (see below). This is crucial to allow data providers to continue doing their work, enhancing, maintaining and updating valuable data.
  • All data, visualizations, and code produced by Our World in Data are completely open access under the Creative Commons BY license. You have the permission to use, distribute, and reproduce these in any medium, provided the source and authors are credited.

Citations

How to cite this page

To cite this page overall, including any descriptions, FAQs or explanations of the data authored by Our World in Data, please use the following citation:

“Data Page: Lifespan inequality: Gini coefficient in men”, part of the following publication: Saloni Dattani, Lucas Rodés-Guirao, Hannah Ritchie, Esteban Ortiz-Ospina and Max Roser (2023) - “Life Expectancy”. Data adapted from Human Mortality Database, United Nations. Retrieved from https://ourworldindata.org/grapher/gini-coefficient-of-lifespan-inequality-in-males [online resource]
How to cite this data

In-line citationIf you have limited space (e.g. in data visualizations), you can use this abbreviated in-line citation:

Human Mortality Database (2024); Aburto et al. (2023) – with major processing by Our World in Data

Full citation

Human Mortality Database (2024); Aburto et al. (2023) – with major processing by Our World in Data. “Lifespan inequality: Gini coefficient in men” [dataset]. Human Mortality Database, “Human Mortality Database”; United Nations, “World Population Prospects” [original data]. Retrieved January 19, 2025 from https://ourworldindata.org/grapher/gini-coefficient-of-lifespan-inequality-in-males