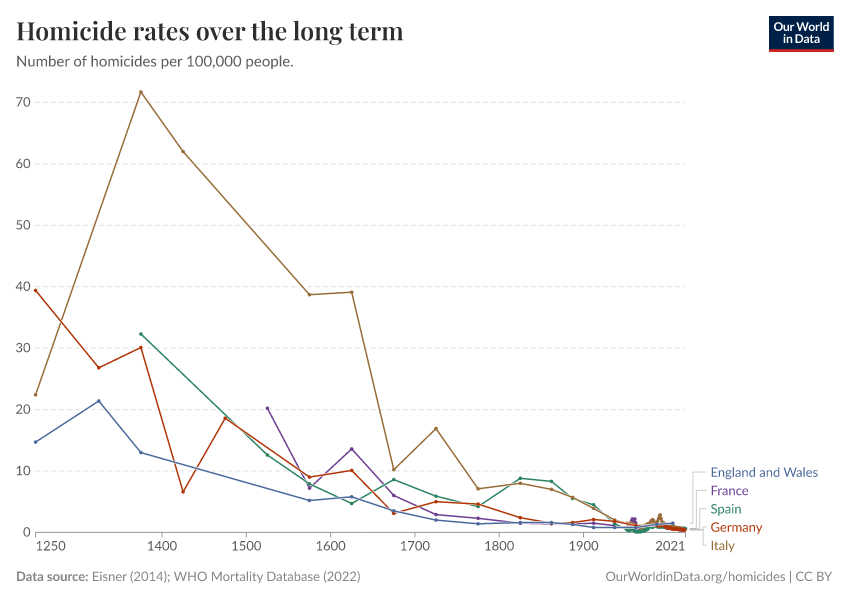
Homicide rates over the long term

What you should know about this indicator
Related research and writing
Sources and processing
This data is based on the following sources
OWID based on Eisner (2014); United Nations Office of Drugs and Crime (2022); WHO Mortality Database (2024)
OWID based on Eisner (2014); United Nations Office of Drugs and Crime (2022); WHO Mortality Database (2024)
How we process data at Our World in Data
All data and visualizations on Our World in Data rely on data sourced from one or several original data providers. Preparing this original data involves several processing steps. Depending on the data, this can include standardizing country names and world region definitions, converting units, calculating derived indicators such as per capita measures, as well as adding or adapting metadata such as the name or the description given to an indicator.
At the link below you can find a detailed description of the structure of our data pipeline, including links to all the code used to prepare data across Our World in Data.
Notes on our processing step for this indicator
All homicide rate estimates from before 1950 are taken from: Table 4 in Eisner, M. (2014) “From Swords to Words: Does Macro-Level Change in Self-Control Predict Long-Term Variation in Levels of Homicide?” In Why Crime Rates Fall and Why They Don’t, edited by Michael Tonry. Vol. 43 of Crime and Justice: A Review of Research, edited by Michael Tonry. Chicago: University of Chicago Press.
In Eisner (2014) homicide rates are given for a range of years - we allocate the homicide rate at the midpoint of the given period. Our data-management and -visualization system can currently only observations that happen in a particular year (or day), therefore we can't store the time-information as presented by the original source and instead allocate the observation the midpoint of the given period.
Historical estimates of homicide rates are derived from national vital statistics and judicial archives. The older data is often fragmented and subject to a number of biases including: geographic bias, incomplete records, changing age structure, wound treatment, and the lethality of weapons.
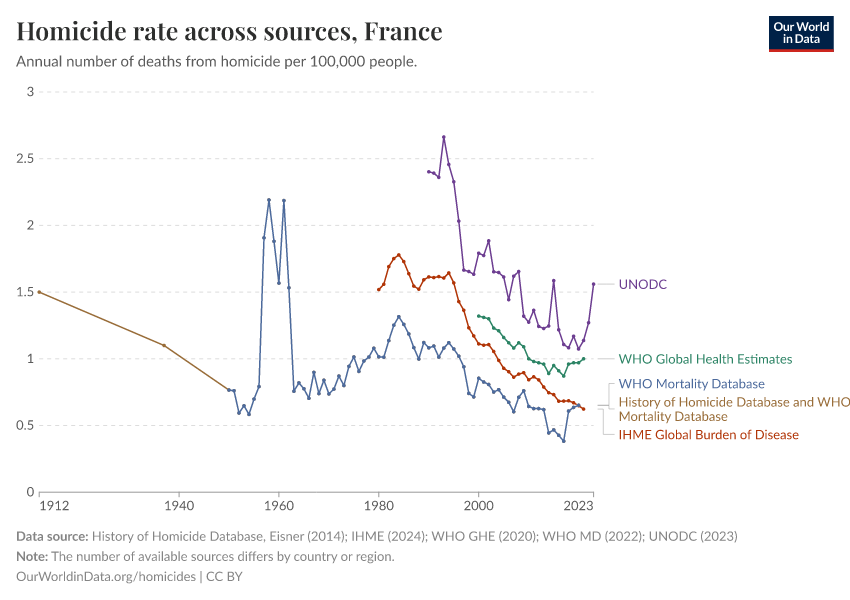
This variable is a combination of homicide rate estimates from Eisner (2014) and the WHO Mortality Database. For the following countries we use Eisner (2014) before the given date and the WHO Mortality Database for all later datapoints:
-
1950: France, Ireland, Netherlands
-
1951: Italy, Spain, Sweden, Switzerland
-
1954: Belgium
-
1990: Germany
For Corsica and Sardinia; England and Wales and Sweden and Finland all datapoints are from Eisner (2014).
All other datapoints not specified above are sourced from the WHO Mortality Database.
Reuse this work
- All data produced by third-party providers and made available by Our World in Data are subject to the license terms from the original providers. Our work would not be possible without the data providers we rely on, so we ask you to always cite them appropriately (see below). This is crucial to allow data providers to continue doing their work, enhancing, maintaining and updating valuable data.
- All data, visualizations, and code produced by Our World in Data are completely open access under the Creative Commons BY license. You have the permission to use, distribute, and reproduce these in any medium, provided the source and authors are credited.
Citations
How to cite this page
To cite this page overall, including any descriptions, FAQs or explanations of the data authored by Our World in Data, please use the following citation:
“Data Page: Homicide rates over the long term”. Our World in Data (2025). Data adapted from Eisner (2014); WHO Mortality Database (2024). Retrieved from https://ourworldindata.org/grapher/homicide-rates-across-western-europe [online resource]How to cite this data
In-line citationIf you have limited space (e.g. in data visualizations), you can use this abbreviated in-line citation:
OWID based on Eisner (2014); United Nations Office of Drugs and Crime (2022); WHO Mortality Database (2024); Eisner (2014); WHO Mortality Database (2024) (2024) – processed by Our World in DataFull citation
OWID based on Eisner (2014); United Nations Office of Drugs and Crime (2022); WHO Mortality Database (2024); Eisner (2014); WHO Mortality Database (2024) (2024) – processed by Our World in Data. “Homicide rates over the long term” [dataset]. Eisner (2014); WHO Mortality Database (2024), “OWID based on Eisner and WHO Mortality Database” [original data]. Retrieved March 10, 2025 from https://ourworldindata.org/grapher/homicide-rates-across-western-europe