How urban is the world?
Urban living is a relatively recent feature of human history.1
In our entry on Urbanization we look at the long-run history of urban populations. By 1800, urban shares were still well below 10 percent, even across today's rich countries.2
It wasn't until the 20th century that rates of urbanization really began to increase substantially. This is seen in the second half of the century in particular.
But how urban is the world today? How many people live in urban areas?
What we know about urban populations and why it matters
Before looking in more detail at the differences in estimates of urban populations, we should first clarify what we do know:
- globally more people live in urbanized settings than not (disputes in these figures are all above the 50% urban mark);
- the broad distribution and density of where people live across the world (sometimes at very high resolution);
- although it can seem like our expanding cities take up a lot of land, less than 2% of global land is defined as built-up area;3
- rates of urbanization have been increasing rapidly across all regions (in 1800, less than 10% of people across all regions lived in urban areas);
- urbanization is expected to continue to increase with rising incomes and shifts away from employment in agriculture;4
- disagreements in urban population numbers arise from definition or boundary differences in what makes a population 'urban'.
Whilst disagreement on the numbers can seem irrelevant, understanding cities, urbanization rates, the distribution, and the density of people matters. The allocation and distribution of resources — ranging from housing and transport access to healthcare, education, and employment opportunities — should all be dependent on where people live. Understanding the distribution of people in a given country is essential to make sure the appropriate resources and services are available where they're needed.
The UN's 11th Sustainable Development Goal (SDG) is to "make cities inclusive, safe, resilient and sustainable". If our aim is to develop resource-efficient, inclusive cities, understanding how many people they must provide for is essential for urban planning.
Let's, therefore, look at the conflicting estimates of how urban our world is, and where these differences come from.
UN estimates: 55% of people live in urban areas
At first glance, this seems like a simple question to answer. Figures reported from the United Nations (UN) deliver a straightforward answer.5
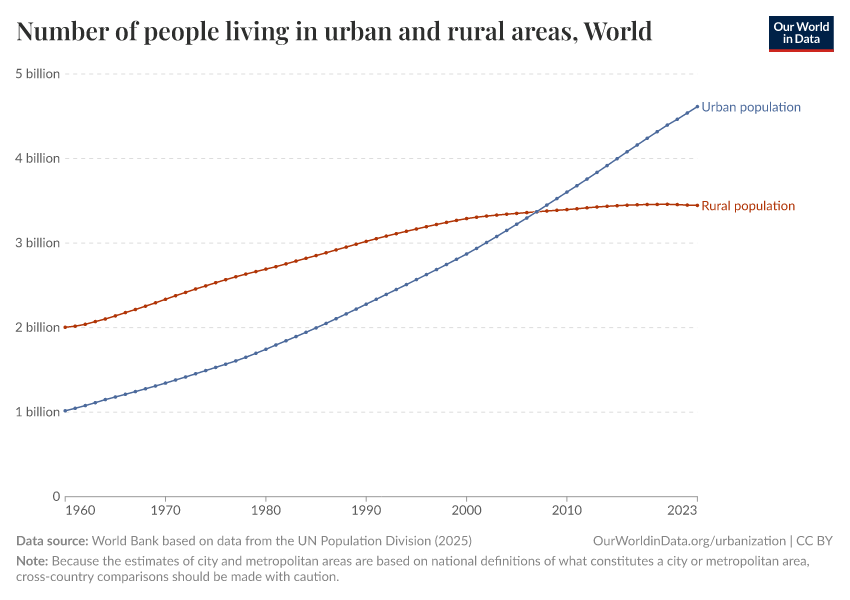
In the chart here we see the total number of people defined as living in urban and rural areas, extending from 1960 to 2020.6 This is based on nationally-collated census figures, combined with UN estimates where census data is unavailable. Here we see that in 1960 twice as many people lived in rural settings (2 billion) than in urban areas (1 billion). In 2007, urban and rural populations were almost exactly equal at 3.33 billion each. In 2016, urban populations increased to 4.4 billion; while the world's rural population had increased only marginally to 3.4 billion.
The UN figures are the most widely referenced and cited on global urbanization. However, they're not without their critics: some researchers suggest that far more people live in urban areas than these figures suggest. Why are they so contested?
How is an urban area defined?
'What defines an urban area?' lies at the center of these debates.
There is currently no universal definition of what 'urban' means. The UN reports figures based on nationally-defined urban shares. The problem, however, is that countries adopt very different definitions of urbanization. Not only do the thresholds of urban versus rural vary, but the types of metrics used also differ. Some countries use minimum population thresholds, others use population density, infrastructure development, employment type, or simply the population of pre-defined cities.
In the table, we highlight the varied definitions across a selection of countries. The UN World Urbanization Prospects database also provides the full downloadable list of statistical definitions for each country.
National definitions of 'urban area' as used for a custom selection of countries7
Country | National definition of ‘urban’ |
|---|---|
Argentina | Localities with 2,000 inhabitants or more. |
Sweden | Built-up areas with 200 inhabitants or more and where houses are at most 200 metres apart. |
Japan | Cities defined as shi. In general, shi refers to a municipality that satisfies the following conditions: (1) 50,000 inhabitants or more; (2) 60 per cent or more of the houses located in the main built-up areas; (3) 60 per cent or more of the population (including their dependents) engaged in manufacturing, trade or other urban type of business. |
India | Statutory places with a municipality, corporation, cantonment board or notified town area committee and places satisfying all of the following three criteria: (1) 5,000 inhabitants or more; (2) at least 75 per cent of male working population engaged in non-agricultural pursuits; and (3) at least 400 inhabitants per square kilometre. |
Zimbabwe | Places officially designated as urban, as well as places with 2,500 inhabitants or more whose population resides in a compact settlement pattern and where more than 50 per cent of the employed persons are engaged in non-agricultural occupations. |
Singapore | Entire population. |
Uruguay | Cities officially designated as such. |
The table illustrates the broad range of definitions between countries which compromises cross-country comparisons. And since the reported global figure is simply the sum of nationally-reported shares, the lack of a universal definition is also problematic for these aggregated figures.
Even if we could define a single metric to use — such as a minimum population threshold in a settlement — countries adopt very different thresholds.
In the chart here we have mapped the minimum population threshold for countries who adopt this within their definition of 'urban'. 2000 and 5000 inhabitants were jointly the most frequently-adopted threshold. However, the variation across countries was vast. Sweden and Denmark set this threshold at only 200 inhabitants; Japan at 50,000 (a 250-fold difference).
European Commission estimates: 85% of people live in urban areas
Critics of current UN figures, therefore, say that such varied definitions of 'urban' lead to a significant underestimation of the world's urban population. Researchers from the European Commission, for example, reported that 85% of people live in urban areas.8
Its project, Atlas of the Human Planet, combines high-resolution satellite imagery with national census data to derive its estimates of urban and rural settlements.
The European Commission applied a universal definition of settlements across all countries:
- Urban center: must have a minimum of 50,000 inhabitants plus a population density of at least 1500 people per square kilometre (km2) or density of build-up area greater than 50%.
- Urban cluster: must have a minimum of 5,000 inhabitants plus a population density of at least 300 people per square kilometre (km2).
- Rural: fewer than 5,000 inhabitants.
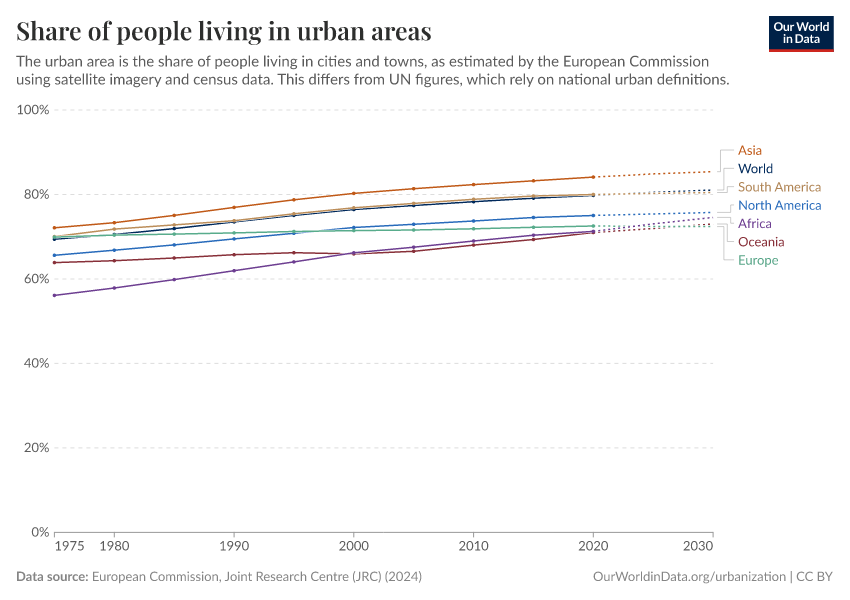
Using these definitions, it reports that 52% of the world lived in urban centers, 33% in urban clusters, and 15% in rural areas in 2015. This makes the total urban share 85% (more than 6.1 billion people). The reported urban share by continent is shown in the chart here.
The European Commission's estimates are also not without its critics. Researchers at the Marron Institute of Urban Management (New York University) challenged these figures as a gross overestimation.9
The authors suggest multiple reasons why such figures are too high: based on agricultural employment figures, they estimate urban populations cannot exceed 60%; the low urban-density threshold adopted by the European Commission means entire cropland regions are classified as urban; and that this low-density threshold is inconsistent with observed population densities on the fringes of cities.
Will we ever reach a consensus on urban population?
Clearly how we define an urban area has a significant impact on its estimated population. UN figures report 4 billion, whilst the European Commission reports 6 billion (a difference of one-third).
While there are clear differences in estimates at the global level, the overall trend in urbanization at national levels (regardless of their definition) is still important. It's vital for India, for example, to know that from 1990 to 2016, its urban population increased by 148 million (increasing from every 4th to every 3rd person). The rate of this change is important for its evaluation of progress, demographic change, and national planning. The lack of consensus on figures at the global level therefore shouldn't overshadow what they represent at national levels.
But would the world adopt a standardized definition? The UN Statistics Division has convened multiple expert groups in recent years to try to work towards a common definition, but none have been successful.
With such a wide array of national definitions, achieving this would be a difficult task. Countries have the right to define what they consider to be urban and rural settlements. One proposed option is to maintain individual definitions for national figures but to adopt a new universal definition for estimating the global and/or regional share.
This may, at least, bring us one step closer to an agreement on how urban the world really is.
Endnotes
Klein Goldewijk, K. , A. Beusen, and P. Janssen (2010). Long term dynamic modeling of global population and built-up area in a spatially explicit way, HYDE 3 .1. The Holocene20(4):565-573. Available at: http://dx.doi.org/10.1177/0959683609356587.
US Census Bureau. Population: 1790-1990. Available at: https://www.census.gov/population/censusdata/table-4.pdf.
Built-up area is defined as cities, town, villages and human infrastructure.
In 1800 when urbanization rates were low, agricultural employment was very high — including in today's rich countries. For example, around 60% of the workforce in France was employed in agriculture in 1800. Today this figure is only a few percent.
UN World Urbanization Prospects (2018). Available at: https://esa.un.org/unpd/wup/Download/.
Note that this data can be viewed for any country or region using the "change country" function in the top-left of the chart.
United Nations, Department of Economic and Social Affairs, Population Division (2018). World Urbanization Prospects: The 2018 Revision, Online Edition. Available at: https://esa.un.org/unpd/wup/.
Pesaresi, M., Melchiorri, M., Siragusa, A., & Kemper, T. (2016). Atlas of the human planet–Mapping human presence on earth with the global human settlement layer. JRC103150. Publications Office of the European Union. Luxembourg (Luxembourg): European Commission, DG JRC. Available at: https://ec.europa.eu/jrc/en/publication/eur-scientific-and-technical-research-reports/atlas-human-planet-mapping-human-presence-earth-global-human-settlement-layer.
Angel et al. (2018). Our Not-So-Urban World. The Marron Institute of Urban Management, New York University. Available at: https://marroninstitute.nyu.edu/uploads/content/Angel_et_al_Our_Not-So-Urban_World,_revised_on_22_Aug_2018_v2.pdf
Cite this work
Our articles and data visualizations rely on work from many different people and organizations. When citing this article, please also cite the underlying data sources. This article can be cited as:
Hannah Ritchie (2018) - “How urban is the world?” Published online at OurWorldinData.org. Retrieved from: 'https://ourworldindata.org/how-urban-is-the-world' [Online Resource]BibTeX citation
@article{owid-how-urban-is-the-world,
    author = {Hannah Ritchie},
    title = {How urban is the world?},
    journal = {Our World in Data},
    year = {2018},
    note = {https://ourworldindata.org/how-urban-is-the-world}
}
Reuse this work freely
All visualizations, data, and code produced by Our World in Data are completely open access under the Creative Commons BY license. You have the permission to use, distribute, and reproduce these in any medium, provided the source and authors are credited.
The data produced by third parties and made available by Our World in Data is subject to the license terms from the original third-party authors. We will always indicate the original source of the data in our documentation, so you should always check the license of any such third-party data before use and redistribution.
All of our charts can be embedded in any site.


