How does the Living Planet Index vary by region?
The Living Planet Index shows an average decline of 73% across studied animal populations globally. But how does this vary by region?
The Living Planet Index (LPI) is a measure of biodiversity that is often misinterpreted. In my accompanying article on the Living Planet Index, I describe these misinterpretations in detail, and what it actually tells us about the state of global biodiversity.
In brief, the LPI measures the average change in the size of studied animal populations. It does not tell us the total change in animal populations; the share of populations that have been lost; or anything about extinctions.
The main headline result of the 2024 Living Planet Index report was that studied animal populations globally have seen an average decline of 73% between 1970 and 2020.1
But the Living Planet Index varies a lot from region to region
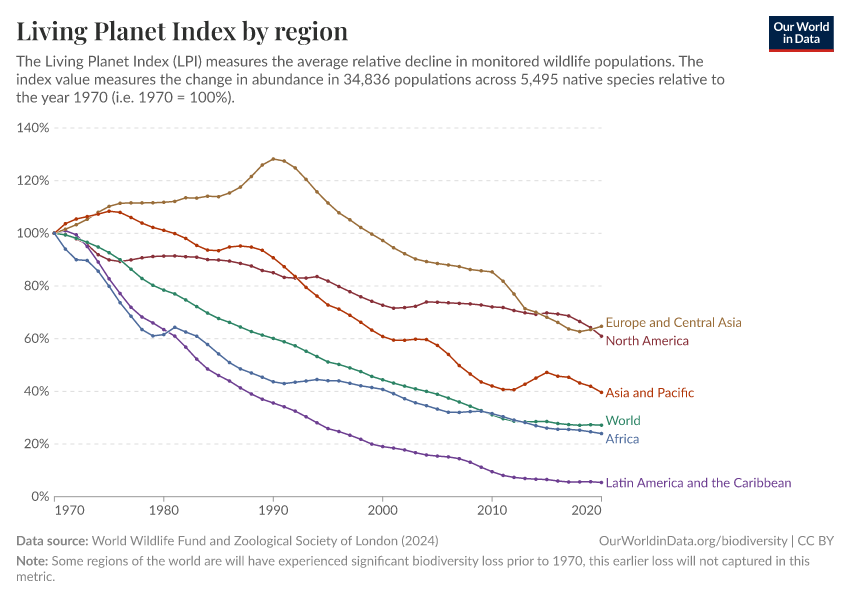
In the chart we see the LPI given by region. This is measured relative to 1970, which is assigned a value of one.
Latin America and the Caribbean
Latin America and the Caribbean have seen the most severe decline of any region. It experienced an average decline of 95% across its studied populations. When we think about the changes in some of the leading drivers of biodiversity loss, we should not be surprised that Latin America has been badly affected.
In recent decades it has experienced intense deforestation and expansion of agricultural land: the primary driver of habitat loss. It is also a biodiversity hotspot, being home to many endemic (unique) tropical species. These species are often highly specialized, and don’t adapt well to changes in local conditions.
The LPI highlights the conversion of grasslands, forests, wetlands and the harvesting of species for hunting and poaching as the main contributors to this decline. It was most severe for fish, reptiles and amphibians.
North America
Since 1970, North America has experienced an average decline of 39%. Since a lot of ecosystem transformation such as the expansion of agriculture happened prior to 1970, which is one of the reasons why its decline has been less severe compared to other regions.
Europe and Central Asia
Europe has seen the smallest decline of all of the continents. An average decline of 35% since 1970. This paints a less severe picture of biodiversity in Europe and Central Asia, and is partly attributed to successful conservation efforts. For example, most countries in Europe are afforesting and restoring wild ecosystems.
It’s also true that most of the continent’s transformation – the expansion of agriculture, deforestation, and destruction of habitats – occurred well before 1970. It is a history that goes back centuries. In other words, it’s biodiversity was already in a significantly depleted state. We’d expect that any declines in the region would be less severe.
Africa
Africa is still rich in biodiversity. It’s the only continent with a significant number of large mammals left. Unfortunately, it has dramatically declined in recent decades with an average decline of 76% since 1970.
Like Latin America, the main drivers of this are habitat loss for expanding agriculture and the overexploitation of animals for hunting, poaching, and wildlife trade. Looking at initial trends in the continent’s subregions, the decline has been most severe in West, Central, and East Africa. Populations have been more stable in the North and South.
Asia-Pacific
The Asia-Pacific spans a wide range of countries and habitats. It includes large terrestrial landscapes but also many small island states. This means it’s home to many endemic species and unique ecosystems.
Since 1970, it has experienced an average decline of 60%.
Endnotes
WWF (2024) Living Planet Report 2024 – A System in Peril. WWF, Gland, Switzerland.
Cite this work
Our articles and data visualizations rely on work from many different people and organizations. When citing this article, please also cite the underlying data sources. This article can be cited as:
Hannah Ritchie (2022) - “How does the Living Planet Index vary by region?” Published online at OurWorldinData.org. Retrieved from: 'https://ourworldindata.org/living-planet-index-region' [Online Resource]BibTeX citation
@article{owid-living-planet-index-region,
    author = {Hannah Ritchie},
    title = {How does the Living Planet Index vary by region?},
    journal = {Our World in Data},
    year = {2022},
    note = {https://ourworldindata.org/living-planet-index-region}
}
Reuse this work freely
All visualizations, data, and code produced by Our World in Data are completely open access under the Creative Commons BY license. You have the permission to use, distribute, and reproduce these in any medium, provided the source and authors are credited.
The data produced by third parties and made available by Our World in Data is subject to the license terms from the original third-party authors. We will always indicate the original source of the data in our documentation, so you should always check the license of any such third-party data before use and redistribution.
All of our charts can be embedded in any site.
