Sanitation
Safe sanitation is essential to reduce deaths from infectious diseases, prevent malnutrition, and provide dignity.
Having access to and being able to use safe sanitation facilities is one of our most basic human needs.
Nevertheless, due to a range of barriers, such as lack of availability, affordability, or cultural norms, around 40% of the world’s population do not use safe sanitation facilities. This is a major health risk. Unsafe sanitation is responsible for hundreds of thousands of deaths each year.
In this article, we give an overview of global and national data on the usage of sanitation facilities and its impact on health outcomes.
Unsafe sanitation is a leading risk factor for death
Unsafe sanitation is responsible for hundreds of thousands of deaths each year
Unsafe sanitation is one of the world's largest health and environmental problems – particularly for the poorest in the world.
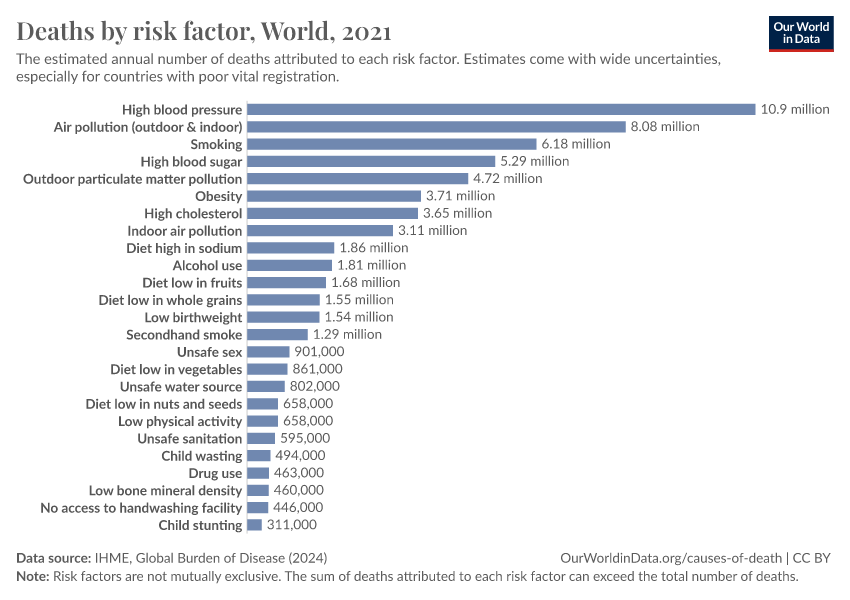
These estimates of the annual number of deaths attributed to a wide range of risk factors are shown here.
Unsafe sanitation is a leading risk factor for infectious diseases, including cholera, diarrhea, dysentery, hepatitis A, typhoid, and polio.1 It also exacerbates malnutrition and, in particular, childhood stunting. In the chart, we see that it ranks as significant risk factor for death globally.
The global distribution of deaths from sanitation
In low-income countries, poor sanitation accounts for a larger share of deaths
In the map we see the share of annual deaths attributed to unsafe sanitation across the world.
The share of deaths attributed to unsafe sanitation is higher in Sub-Saharan Africa and in some areas south and southeastern Asia.
When we compare the share of deaths attributed to unsafe sanitation either over time or between countries, we are not only comparing the extent of unsafe sanitation but its severity in the context of other risk factors for death.
Sanitation's share does not only depend on how many die prematurely from it but what else people are dying from and how this is changing.
Death rates are much higher in low-income countries
Death rates from unsafe sanitation give us an accurate comparison of differences in mortality impacts between countries and over time. In contrast to the share of deaths, death rates are not influenced by how other causes or risk factors for death are changing.
In this map, we see death rates from unsafe sanitation across the world. Death rates measure the number of deaths per 100,000 people in a given country or region.
What becomes clear is the large differences in death rates between countries: rates are high in lower-income countries, particularly across Sub-Saharan Africa and Asia.
Rates can be more than 1,000 times higher in many low-income countries than in rich countries.
We see this relationship clearly when we plot death rates from unsafe sanitation versus income, with both indicators on a log scale.
Usage of safe sanitation
Nearly half of the world does not use safely managed sanitation
SDG Target 6.2 is to: “achieve access to adequate and equitable sanitation and hygiene for all and end open defecation” by 2030.
In recent years, just over half of the world's population has been using safely managed sanitation. It is shocking that nearly one in two don’t. Many people do not have any sanitation facilities at all and instead have to practice open defecation.
The world has made progress in recent years. But this has been far too slow. Much of the world’s population still does not use safely managed sanitation.
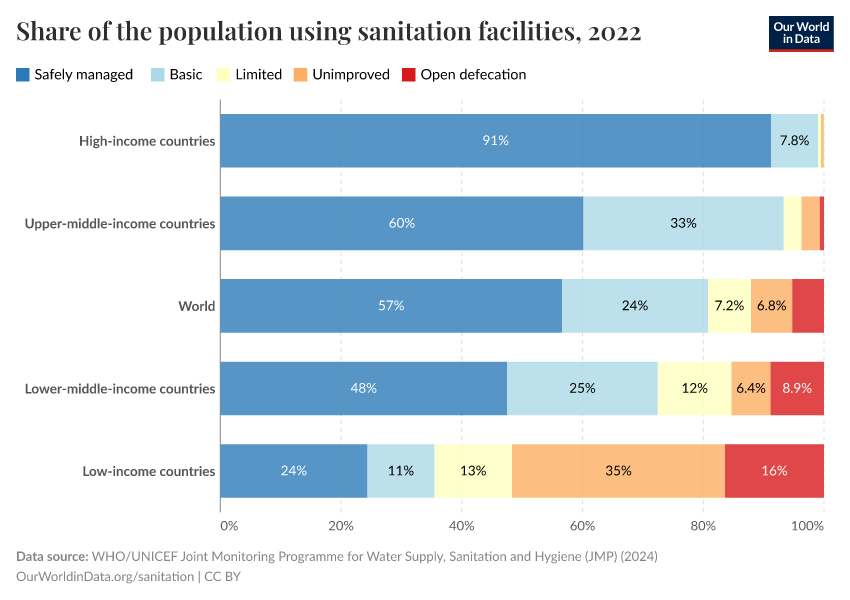
In the next chart, we see the breakdown of sanitation facilities usage globally and across regions and income groups.
We see that in countries with the lowest incomes, only around one in five people use safe sanitation, much like safe drinking water; most live in Sub-Saharan Africa.
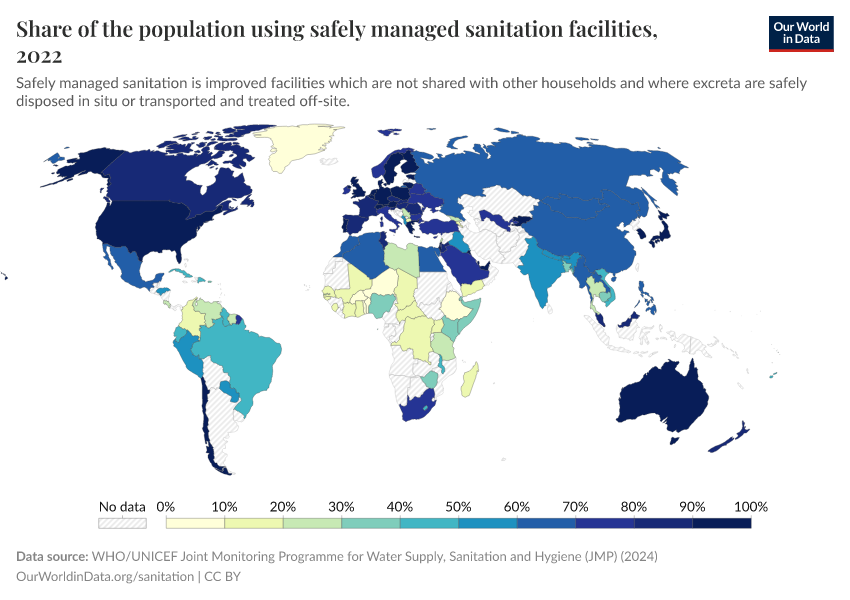
In the map shown, we see the share of people across the world who use safely managed sanitation.
How many people do not use safe sanitation?
In the map shown, we see the number of people across the world who do not use safely managed sanitation.
Use of improved sanitation
What share of people do not use improved sanitation?
'Improved' sanitation is defined as facilities that ensure hygienic separation of human excreta from human contact. This includes facilities such as flush/pour flush (to piped sewer system, septic tank, pit latrine), ventilated improved pit (VIP) latrine, pit latrine with slab, and a composting toilet.
In the map shown, we see the share of people across the world who do not use improved sanitation.
How many people do not use improved sanitation?
In the map shown, we see the number of people across the world who do not have access to improved sanitation.
Open defecation
What share of people practice open defecation?
Open defecation refers to the practice of defecation in fields, forests, bushes, bodies of water, or other open spaces.
Open defecation has a number of negative health and social impacts, including the spread of infectious diseases, diarrhea (especially in children), adverse health outcomes in pregnancy, malnutrition, as well as increased vulnerability to violence — particularly for women and girls.2
The map shows the share of people practicing open defecation across the world.
Open defecation is mainly a rural issue
In the chart, we see the prevalence of open defecation in rural areas versus urban areas. For the majority of countries, the share of the population practicing open defecation in urban areas is typically quite low.
For rural populations, however, the share of the population practicing open defecation tends to be higher and varies markedly between countries.
Although open defecation in urban areas is still a pressing issue in many countries, the problem is much more prevalent in rural areas.
What determines levels of sanitation usage?
Usage of better sanitation facilities increases with income
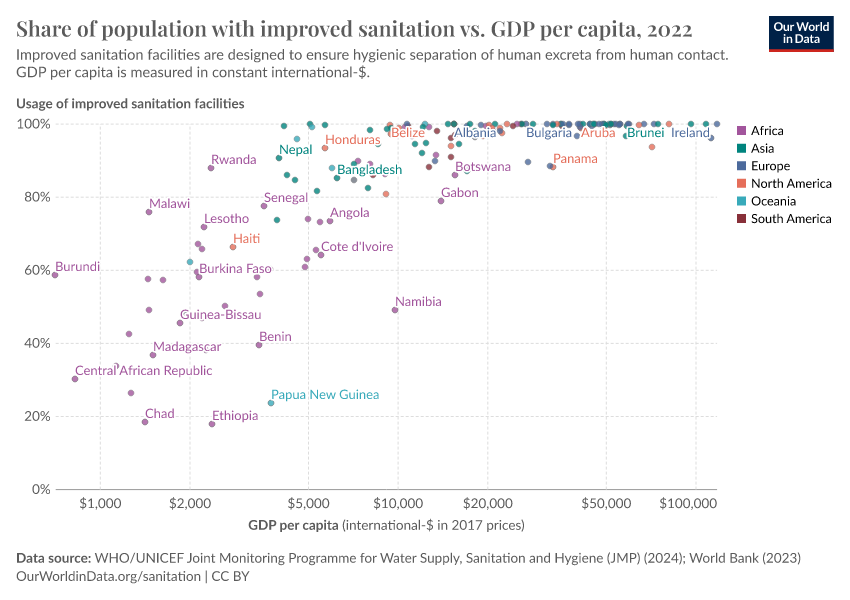
The provision of better sanitation facilities tends to increase with income. In the chart, we see the share of the population using improved sanitation versus gross domestic product (GDP) per capita.
Overall, we see that using improved sanitation increases as countries get richer.
Other health impacts of poor sanitation
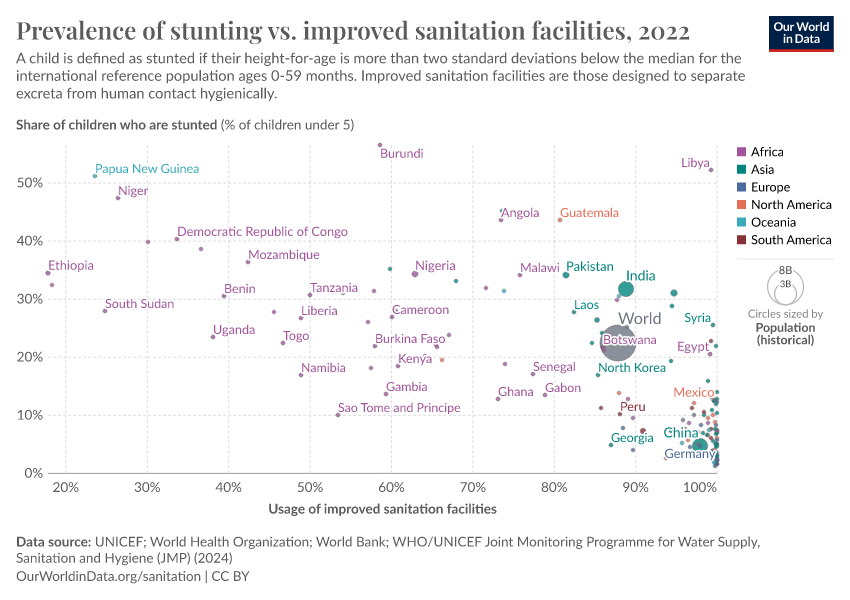
Stunting is higher where usage of improved sanitation is low
Stunting — determined as having a height-for-age more than two standard deviations below the WHO Child Growth Standards median — is a sign of chronic malnutrition.3
Although linked to poor nutritional intake (which we cover in our topic page on hunger and undernourishment), it is also linked to a range of compounding factors, including the recurrence of infectious diseases, childhood diarrhea, and poor sanitation & hygiene.
In the chart, we see the prevalence of stunting in children under five years old versus the share of the population using improved sanitation facilities. Overall, we see a negative correlation: rates of childhood stunting are typically higher in countries with lower usage of improved sanitation facilities.
Definitions
Categories of sanitation facilities:
Safely managed sanitation facilities: Improved sanitation facilities that are not shared with other households and where:
- excreta is safely disposed of in situ or
- excreta is transported and treated off-site.
Basic service: Private improved facility which separates excreta from human contact;
Limited service: Improved facility shared with other households;
Unimproved service: Unimproved facility that does not separate excreta from human contact;
No service: open defecation.
Additional relevant definitions:
Improved sanitation facilities: Facilities that hygienically separate human excreta from human contact. They include flush/pour flush (to piped sewer system, septic tank, pit latrine), ventilated improved pit (VIP) latrine, pit latrine with slab, and composting toilet.
Improved sanitation facilities range from simple but protected pit latrines to flush toilets with a sewerage connection. To be effective, facilities must be correctly constructed and properly maintained. 4
Improved sanitation facilities is an umbrella term for the "safely managed," "basic," and "limited" services listed above.
Open defecation: People practicing open defecation refers to the percentage of the population defecating in the open, such as in fields, forests, bushes, open bodies of water, on beaches, in other open spaces, or disposed of with solid waste.
Endnotes
WHO (2023) – Fact sheet – Drinking water. Updated October 2023. Online here.
Mara, D. (2017). The elimination of open defecation and its adverse health effects: a moral imperative for governments and development professionals. Journal of Water Sanitation and Hygiene for Development, 7(1), 1-12. Available online.
World Health Organization (2014). WHA Global Nutrition Targets 2025: Stunting Policy Brief. Available online.
World Bank & WHO/UNICEF Joint Monitoring Programme (JMP) for Water Supply and Sanitation. World Development Indicators Metadata. Available online.
Cite this work
Our articles and data visualizations rely on work from many different people and organizations. When citing this article, please also cite the underlying data sources. This article can be cited as:
Hannah Ritchie, Fiona Spooner, and Max Roser (2019) - “Sanitation” Published online at OurWorldinData.org. Retrieved from: 'https://ourworldindata.org/sanitation' [Online Resource]BibTeX citation
@article{owid-sanitation,
    author = {Hannah Ritchie and Fiona Spooner and Max Roser},
    title = {Sanitation},
    journal = {Our World in Data},
    year = {2019},
    note = {https://ourworldindata.org/sanitation}
}
Reuse this work freely
All visualizations, data, and code produced by Our World in Data are completely open access under the Creative Commons BY license. You have the permission to use, distribute, and reproduce these in any medium, provided the source and authors are credited.
The data produced by third parties and made available by Our World in Data is subject to the license terms from the original third-party authors. We will always indicate the original source of the data in our documentation, so you should always check the license of any such third-party data before use and redistribution.
All of our charts can be embedded in any site.
