The missing economic measure: wealth
Gross domestic product (GDP) is increasingly seen as an incomplete measure of economic activity. Another measure gaining traction as a supplement to GDP is national wealth.
GDP – or gross domestic product – is a statistical figure so engrained in our understanding of the economy that it is often taken to be indicative of how well a country and its people are doing.
But what does GDP actually tell us, and why is it increasingly seen as an incomplete and sometimes misleading measure of both economic activity and wellbeing?
In this post, we answer this question and discuss a "new," albeit historically older measure which is gaining traction as a much-needed supplement to GDP: national wealth.
What GDP does and doesn't tell us
So, what is GDP? GDP is a measure of economic activity – in terms of market-based gross output – in a given period (often a year). This is of course useful in many ways. GDP growth, when captured accurately, has the potential to tell us about the pace of change and rising levels of consumption.
Equally, a cessation of GDP growth can serve as an important red flag: stalling enterprises and increases in unemployed workers tend to imply hardship and losses in welfare.
However, there are important changes that GDP does not shed light on, and indeed might give us incorrect signals about.
Think about climate change, a critical issue that has been increasingly under the international spotlight. An economy can increase its carbon dioxide (CO2) emissions and drive up local pollutants – both clearly harmful to the long-term wellbeing of the population – while being rewarded with rising GDP figures.
Similarly, a natural disaster might harm people, destroy infrastructure, and require expensive emergency measures – yet thanks to a rise in spending, this too could temporarily register as an increase in GDP.
On the flip side, beneficial endeavors such as attempting to stall the alarming rate of biodiversity loss or deforestation not only fail to register in our headline statistic; they might slow its growth.
This is where wealth accounting comes in
Rather than measuring flows, as GDP does, wealth is an indicator of an economy’s underlying capital stocks. Wealth, if measured in detail, accounts for the assets such as natural capital, produced capital, and human capital that underpin growth and consumption possibilities, and in this way shows us viable development pathways.1
In the event of a natural disaster or rising pollution, for example, while GDP might grow, wealth measures would alert us to the depletion of underlying physical and natural capital stocks and the need for targeted investment. A detailed enough balance sheet would thus theoretically allow for the sustainable management of an economy's productive capital. Therefore, while GDP has little to say about whether a nation’s assets can sustain current consumption levels into the future, wealth measures can tell us exactly this.
The relationship between wealth and GDP is analogous to company accounts: the balance sheet of a company describes the stock of useful assets owned by a company (akin to wealth), while the profit and loss statement describes the flows of revenue, costs, and net income that the company has been able to generate using those assets (akin to GDP).
Ultimately, the two measures are necessarily linked and best considered alongside each other.
Genuine saving: a measure of change in wealth
With the same logic described above, we can understand that the current change to a country’s total wealth is linked to whether a country’s future consumption will lie above or below its current consumption level.
Genuine saving (also known as “adjusted net saving” or “comprehensive investment”) provides a measure of the change in wealth. If a country’s genuine saving is negative, this indicates that the country is consuming more than it is saving, thus eating into its capital stocks. If genuine saving is positive, the country is augmenting its wealth and theoretically improving its future prospects.
It is important, however, to emphasize that this measure of sustainability assumes perfect substitutability among different forms of capital. For example, a country can maintain the same level of genuine saving by depleting natural capital while simultaneously investing in produced capital.
Yet this overlooks the fact that some natural capital that is essential to our existence on Earth – such as productive soils, a stable climate, and functioning ecosystems – face tipping points beyond which they cannot be easily restored.
Fittingly, this type of assumption about substitutability underpins a concept often referred to as "weak sustainability." "Strong sustainability," on the other hand, focuses on the fact that natural capital cannot always be substituted for by other forms of capital.
Measures of genuine saving
With this important distinction in mind, let us consider existing measures of genuine saving.
Researchers Blum, Ducoing and McLaughlin (2017)2 provide a view of the long-run development of genuine saving, covering eleven countries over the span of the 20th century.
Their definition of genuine savings is as follows: Genuine savings = net fixed produced capital formation and overseas investment + change in natural capital + education expenditure. Broadly speaking, their measure of saving accounts for changes in wealth in terms of the underlying produced, human, natural, and financial capital.
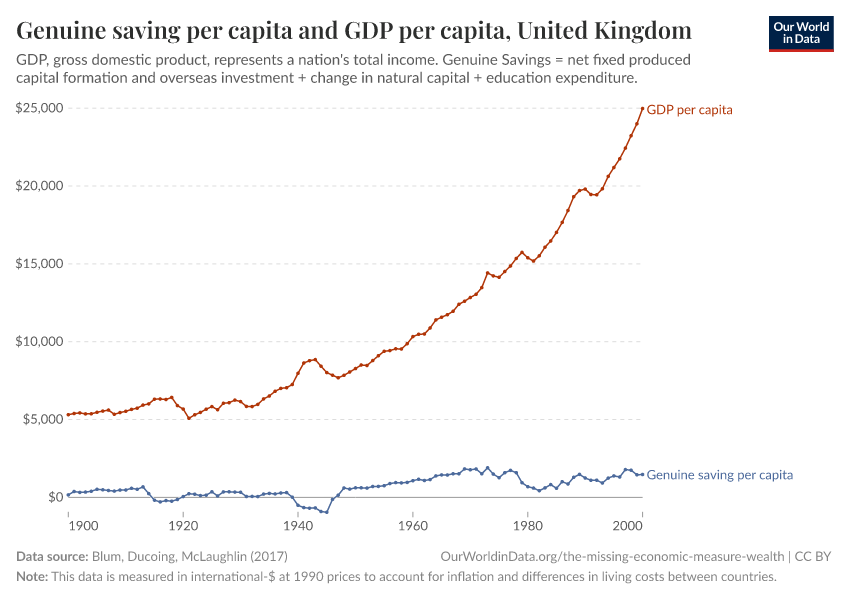
In the chart here, we see genuine saving plotted alongside GDP for the years 1900–2000 for the UK. You can see the data for different countries by clicking "Change country" within the chart.
In the chart, we can make out some of the political and social developments of the 20th century reflected statistically. The effects of the Great Depression and Second World War register as dips in genuine saving, while GDP simultaneously grows.
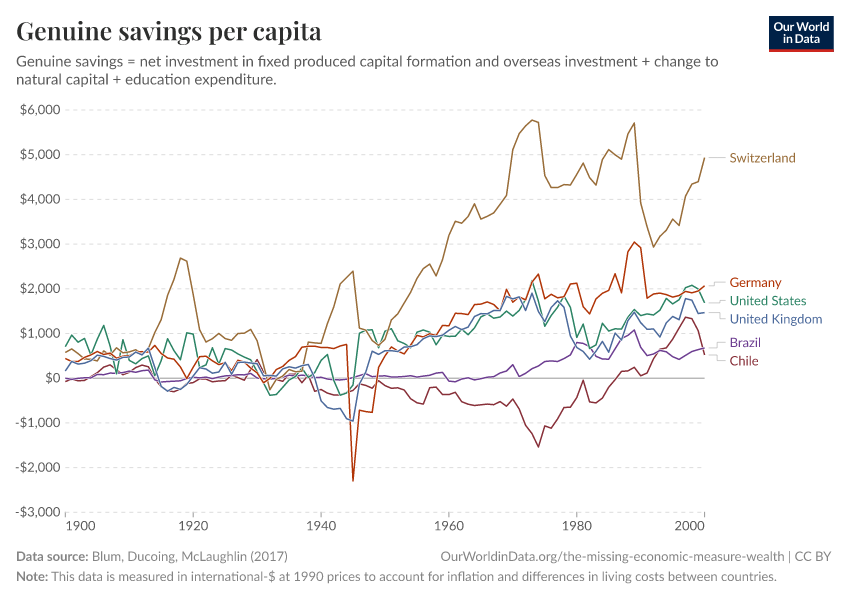
This is the case for other early-industrializing countries as well. Looking at the data for Switzerland, however, shows an anomaly – as genuine saving declines across most European countries during the two World Wars, Switzerland experienced periods of large saving. This highlights the country's role as a haven for capital.
Interestingly, the time between the Great Depression and World War II also marks the moment in which GDP emerged as the foremost measure of the economy. Although its creators Simon Kuznets and Colin Clark intended to introduce an indicator that would inform us about welfare, wartime pressure took priority.
GDP was thus developed as a way to calculate the extent to which people in an economy could be forced to divert efforts into wartime production.3 In this telling context, Kuznets warned that GDP would fail to make the distinction between the "quantity and quality of growth, between its costs and returns, and between the short and the long term."4
Genuine saving across different countries
In this chart, we can see a comparison of genuine saving across different countries over the 20th century.
What does genuine saving look like in the years after 2000? The researchers responsible for producing the data presented above are currently working on expanding the dataset's country-coverage. In the interim, we can see estimates calculated using a different methodology from the World Bank.
The next chart shows the World Bank's measure of Adjusted Net Saving (ANS), also an indicator of genuine saving.
Total and per capita wealth by asset-type
Now that we have considered the long-term evolution of changes in wealth, let us consider the figures on total and per capita wealth.
As mentioned, this is by no means a new idea. As we examine the various forms of capital that make up an economy – and which are only just now beginning to garner renewed attention – let us keep in mind that wealth has a history longer than that of GDP. Think of Adam Smith's aptly named "The Wealth of Nations", originally published in 1776, and the statistician Robert Giffen, who examined stocks of capital as closely as flows of output in 1889.5 Even the Victorians, who 150 years ago constructed much of the physical capital that we continue to rely upon today, could intuit the lasting impact of capital stocks.
The data visualized here draws on figures released by the World Bank, who have been at the forefront of developing the methodology and accounting practices behind modern-day wealth accounts. Their methodology measures wealth from the "bottom-up," calculating the separate value of four asset groups – natural capital, produced capital, human capital, and net foreign assets – which together account for the majority of national wealth.6
Each of these asset groups is measured, where possible, as the net present value of the stream of future returns. This approach intends to capture the lifetime value of an asset, thus allowing us to examine assets, income, and consumption within a framework linking them to future sustainability. The most important improvement to this set of wealth accounts is the inclusion of human capital, calculated as the discounted value of lifetime earnings.
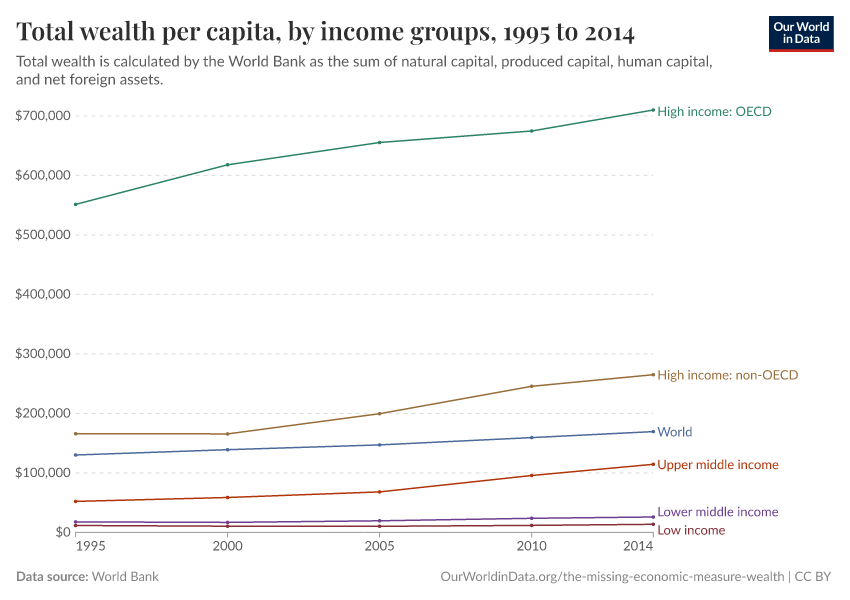
The chart here shows total wealth per capita by country groupings based on income level. We can see that average per capita wealth across the world grew from $130,032 to $169,349 – or a rate of 1.3 percent per year – between 1995 and 2014. This signals an overall gradually increasing asset base.
However, it also contains differences in wealth accumulation between rich and poor countries. Over the last twenty years, the concentration of wealth among high income countries fell as middle income countries – and most notably upper middle income countries – increased their share of global wealth. Low income countries, however, held on to only 1% of global wealth in 2014, about the same share as in 1995.
Total wealth by asset group
By breaking down total wealth into its underlying asset groups, we can see that human capital holds the largest share of global wealth in 2014, at 65% of all wealth.
Notably, this figure fell from 69% in 1995 – a development which the World Bank attributes to the steep decline after 2000 in the shares of human capital in high and upper middle income countries. This decline is in turn a result of rapidly aging labor forces and slumping real wages (especially in high-income OECD countries).
Still, according to the World Bank, human capital is the largest component of wealth in all but low income countries, where the value of natural capital exceeds that of human capital.
Among all income groups except high income non-OECD countries, we see that net foreign assets are negative. This implies the role of oil-producers as net creditors to the world.7 You can compare the asset breakdown of total wealth for various country groupings by clicking on "Change country" in the chart.
A closer look at natural capital
Some asset groups can be further broken down into sub-components. This is particularly useful for examining natural capital in individual countries – and especially so in countries with larger shares of natural capital.
A breakdown of natural capital allows us to distinguish between renewable assets such as forests, and non-renewable ones such as fossil fuels. Here we see that Saudi Arabia is unsurprisingly highly dependent on fossil energy resources.
Notably, natural capital accounts currently fall short of capturing aspects of nature – such as biodiversity – that have been in dramatic decline. To attempt to address this pressing issue, various groups are exploring the valuation of ecosystem services.
Conclusion
The data from the World Bank is an important step toward statistical measures that shed light on material wellbeing and our ability to sustain it.
As wealth gains traction in public thinking – it was featured in the winning entry of the 2017 Indigo Prize, and has been a prominent aspect of other proposals to reform economic measurement8 – we may hope to see country statistical agencies releasing wealth data alongside GDP data.
The implications of such widespread adoption could be big. Focusing on wealth as the primary measure of the economy would mean a complete recasting of the way we determine progress: one that finally shifts away from growth-at-all-costs and pays attention to our future.
Endnotes
According to the World Bank's definition and calculation of wealth, the underlying assets include: Natural capital (consisting of energy, minerals, agricultural land, protected areas, and forests), produced capital (consisting of machinery, structures, equipment and urban land), human capital (consisting of the knowledge, skills, and experience embodied in the workforce and calculated using the lifetime earnings approach), and net foreign assets (including portfolio equity, debt securities, foreign direct investment, and other financial capital held in other countries). For more details on the methodology, see the here.
Blum, Ducoing, McLaughlin. “A sustainable century? Genuine savings in developing and developed countries 1900-2000” in National Wealth: What is Missing, Why it Matters. Eds. Hamilton, K., & Hepburn, C. Oxford University Press.
Coyle, D., 2015. GDP: A brief but affectionate history. Princeton University Press.
Simon Kuznets in: Herbert David Croly eds. (1962) The New Republic Vol. 147. p. 29: About rethinking the system of national accounting
Giffen, R. (1889). The growth of capital. London: G. Bell.
The metric is nonetheless an evolving measure, and is not necessarily completely inclusive in its scope at present. Other forms of capital that are not captured but are currently being researched include social and institutional capital as well as ecosystem services.
Forthcoming: World Bank (2018). The Changing Wealth of Nations.
See for example recommendation 3 of the influential Stiglitz-Sen-Fitoussi Report on the Measurement of Economic Performance and Social Progress: "Consider income and consumption jointly with wealth" pg. 24, available online.
Cite this work
Our articles and data visualizations rely on work from many different people and organizations. When citing this article, please also cite the underlying data sources. This article can be cited as:
Sandra Tzvetkova and Cameron Hepburn (2018) - “The missing economic measure: wealth” Published online at OurWorldinData.org. Retrieved from: 'https://ourworldindata.org/the-missing-economic-measure-wealth' [Online Resource]BibTeX citation
@article{owid-the-missing-economic-measure-wealth,
    author = {Sandra Tzvetkova and Cameron Hepburn},
    title = {The missing economic measure: wealth},
    journal = {Our World in Data},
    year = {2018},
    note = {https://ourworldindata.org/the-missing-economic-measure-wealth}
}
Reuse this work freely
All visualizations, data, and code produced by Our World in Data are completely open access under the Creative Commons BY license. You have the permission to use, distribute, and reproduce these in any medium, provided the source and authors are credited.
The data produced by third parties and made available by Our World in Data is subject to the license terms from the original third-party authors. We will always indicate the original source of the data in our documentation, so you should always check the license of any such third-party data before use and redistribution.
All of our charts can be embedded in any site.


