Water Use and Stress
How much water do we use? How did it change over time?
This page was first published in 2015. We made minor changes to the text in February 2024.
This article previously covered aspects of clean water and sanitation access; you can now find this material in our topic pages on Clean Water and Sanitation.
Other research and writing on water use and stress on Our World in Data:
- Dairy vs. plant-based milk: what are the environmental impacts?
- What are the environmental impacts of food and agriculture?
Freshwater use
Global freshwater use
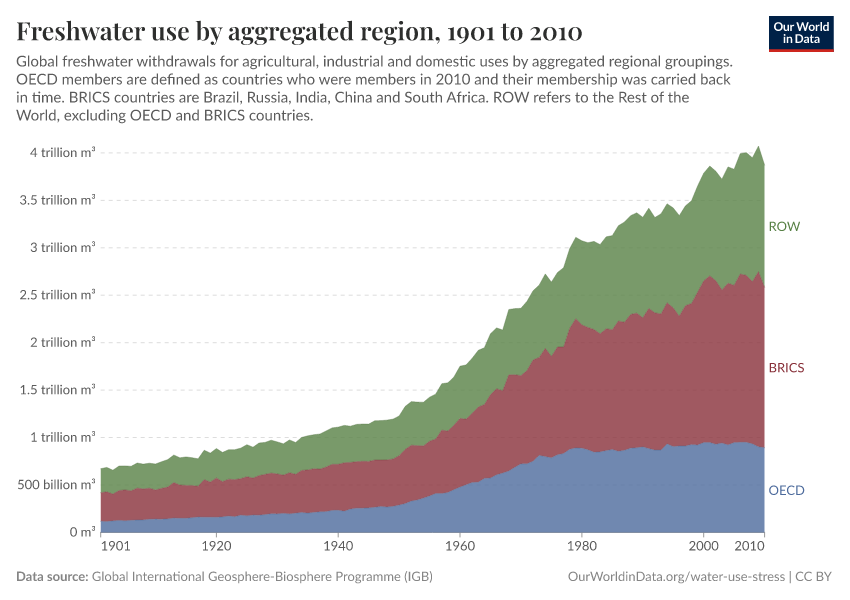
A growing global population and economic shift towards more resource-intensive consumption patterns means that global freshwater use has increased approximately six-fold since 1900. Freshwater use includes freshwater withdrawals for agriculture, industry, and municipal uses. This is shown in the chart. Rates of global freshwater use increased sharply from the 1950s onwards but since 2000 appear to be plateauing, or at least slowing.
Freshwater withdrawals by country
This breakdown of total freshwater withdrawals is shown by country in the chart. In recent years, India, China, and the United States are the three countries with the largest freshwater withdrawals.
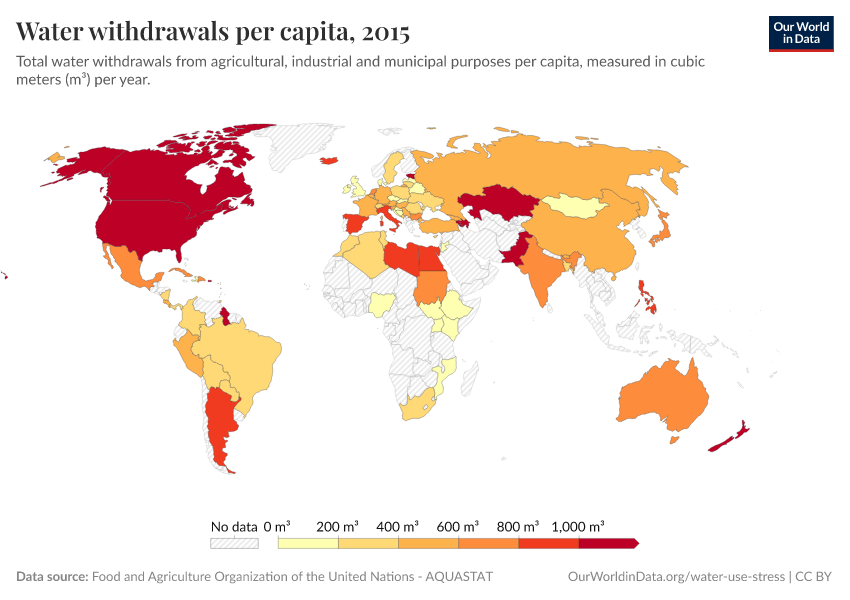
Water withdrawals per capita
Levels of water use vary significantly across the world. The visualization shows the average level of water withdrawal per person per year. As described in detail in our Data Quality & Definitions section, water withdrawal is defined as the quantity of freshwater taken from groundwater or surface water sources (such as lakes or rivers) for use in agricultural, industrial, or domestic purposes.
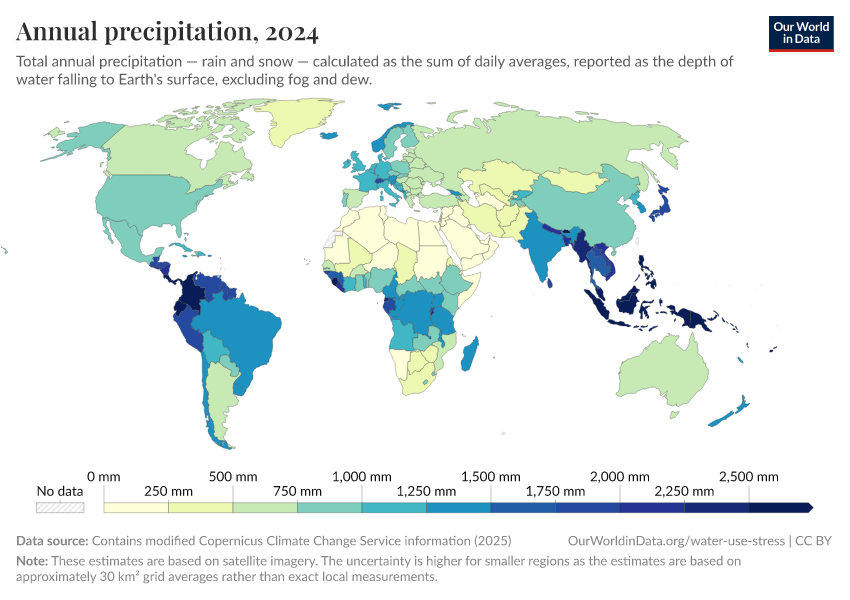
As shown, there is a large variance in levels of water withdrawal rates across the world - this can depend on a range of factors, including climate and the importance of a country's agricultural or industrial sector, as explored in the sections below.
Renewable freshwater resources
Renewable freshwater resources per capita
To maintain sustainable levels of water resources, rates of water withdrawals must be below rates of freshwater replenishment. 'Renewable internal freshwater flows' refer to internal renewable resources (internal river flows and groundwater from rainfall) in a country.
Renewable internal flows are, therefore, an important indicator of water security or scarcity. If rates of freshwater withdrawal begin to exceed the renewable flows, resources begin to decline. The chart shows the level of renewable internal freshwater resources per capita.
Per capita renewable resources depend on two factors: the total quantity of renewable flows and the size of the population. If renewable resources decline — as can happen frequently in countries with large annual variability in rainfall, such as monsoon seasons — then per capita renewable withdrawals will also fall. Similarly, if total renewable sources remain constant, per capita levels can fall if a country's population grows.
As we see, per capita renewable resources are declining in many countries, mainly as a result of population increases.
Per capita renewable water resources by region
The chart shows the average per capita renewable freshwater resources across geographical regions, measured in cubic meters per person per year.
Quantity of renewable freshwater resources by region
The chart shows the total internal renewable freshwater resources by region.
Agricultural water withdrawals
Freshwater use in agriculture
Water is an essential input to global agriculture, whether in the form of rainfed sources or pumped irrigation. The visualization shows the total quantity of freshwater withdrawals that are used in agriculture, whether in the form of food crops, livestock, biofuels, or other non-food crop production.
India's agricultural water consumption has been growing rapidly — almost doubling between 1975 and 2010 — as its population and total food demand continue to increase.
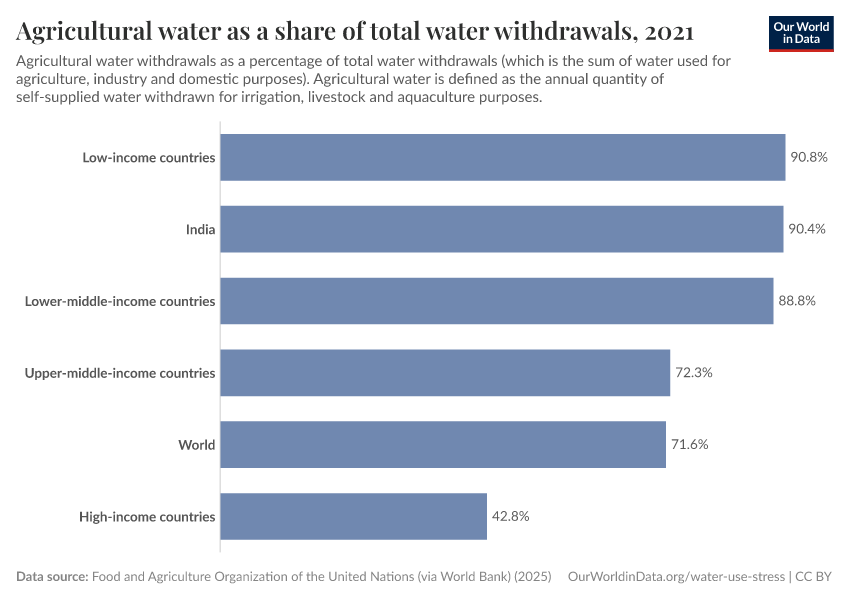
Share of freshwater withdrawals used in agriculture
How do agricultural freshwater withdrawals compare to industrial and domestic sources? Globally, we use approximately 70 percent of freshwater withdrawals for agriculture.1
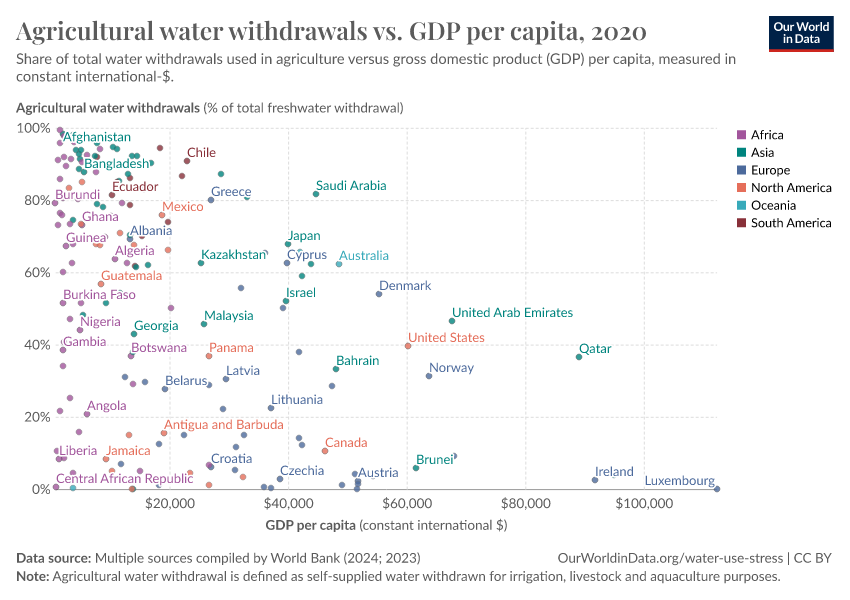
However, this share varies significantly by country – as shown in the chart, which measures the percentage of total freshwater withdrawals used for agriculture. Here, we see large variations geographically and by income level. The average agricultural water use for low-income countries is much higher than it is for high-income countries.
There are a number of countries across South Asia, Africa, and Latin America that use more than 80 percent of water withdrawals for agriculture. Many countries in Europe tend to use a much lower share of water for agriculture; Germany and the Netherlands use less than one percent.
Irrigation
What share of agricultural land is irrigated?
Irrigation — the deliberate supply of agricultural land with water — has been an important input factor in the observed increase of crop yields across many countries in recent decades. It has also been a strong driver in the quantity of water used for agriculture.
The share of the total agricultural area (the combination of arable and grazing land) that is irrigated is shown in the chart. As we can see, irrigation is particularly prevalent across South Asia and the Middle East, with many countries irrigating more than a fifth of their agricultural area.
Slower progress in increasing crop yields in recent decades in Sub-Saharan Africa has been partly attributed (among other factors including fertilizer application rates and crop varieties) to lower uptake of irrigation in Sub-Saharan Africa.2
Industrial water withdrawals
Water use in industry
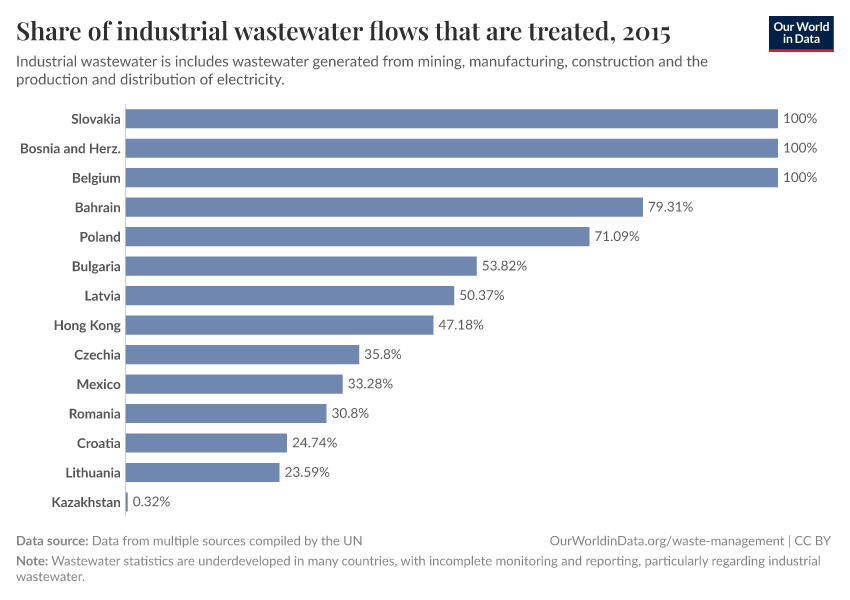
Water is used for a range of industrial applications, including dilution, steam generation, washing, and cooling of manufacturing equipment. Industrial water is also used as cooling water for energy generation in fossil fuel and nuclear power plants (hydropower generation is not included in this category) or as wastewater from certain industrial processes.
The visualization shows the total annual water withdrawals which are used for industrial purposes. The United States and China are two countries that withdraw the most water for industrial uses.
Many countries across the Americas, Europe, and East Asia & Pacific regions use more than one billion m³ for industrial uses per year. Freshwater withdrawal for industrial uses is typically much lower across Sub-Saharan Africa.
Share of freshwater withdrawals used in industry
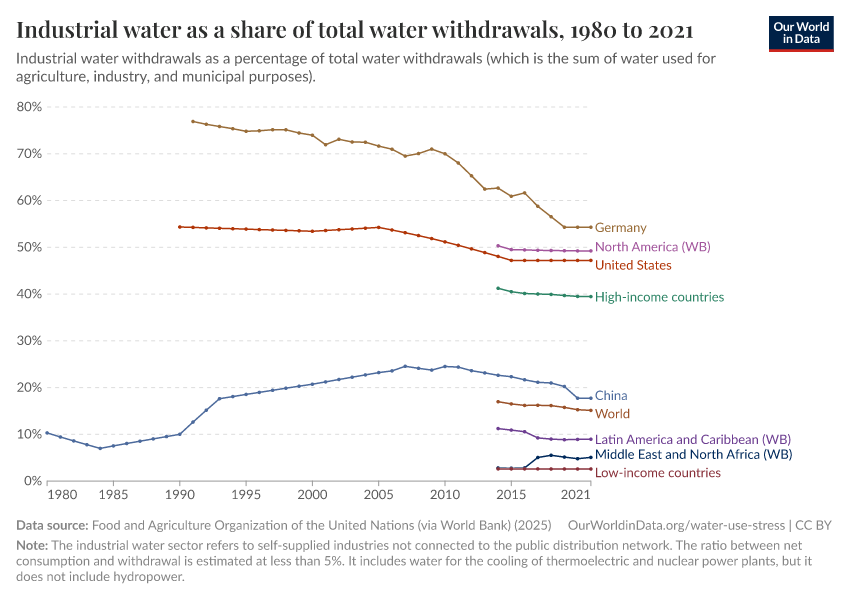
The visualization provides an overview of industrial water withdrawals measured as the share of total water withdrawals (which is the sum of agricultural, industrial, and domestic uses).
In contrast to the global distribution of agricultural water withdrawals, industrial water usage tends to dominate in high-income countries and is small in low-income countries.
The regions with the greatest share are Central and Eastern Europe. Across Sub-Saharan Africa, these industrial water withdrawals contribute to a very small share of total withdrawals.
Municipal water withdrawals
Freshwater use for households and public services
Municipal water is defined as the water we use for domestic, household purposes, or public services. This is typically the most 'visible' form of water: the water we use for drinking, cleaning, washing, and cooking.
Municipal water withdrawals are shown in the chart. China, India, and the United States have the highest domestic water demands. This is partly down to the large populations of these countries and higher per capita water demands in the United States.
Share of freshwater withdrawals used in households
Despite being the most visible use of freshwater, domestic demands for most countries are small relative to agricultural and industrial applications. Globally, around 10 percent of withdrawals are used for municipal purposes.
Municipal uses as a share of total water withdrawals across the world are shown in the chart. The majority of countries use less than 30 percent of withdrawals for domestic purposes.
The share of municipal water in some countries across Sub-Saharan Africa can be high as a result of very low demands for agricultural and industrial withdrawals. Domestic uses of water withdrawals can also dominate in some countries across Europe with high rainfall, such as the United Kingdom and Ireland, where agricultural production is often largely rainfed and industrial output is low.
Water stress and scarcity
As the global population grows (increasing agricultural, industrial, and domestic demands for water) and water demand increases, water stress and the risk of water scarcity are now a common concern. This is even more applicable for particular regions with lower water resources and/or larger population pressures.
Water stress is defined based on the ratio of freshwater withdrawals to renewable freshwater resources. Water stress does not insinuate that a country has water shortages, but it does give an indication of how close it may be to exceeding a water basin's renewable resources. If water withdrawals exceed available resources (i.e., greater than 100 percent), then a country is either extracting beyond the rate at which aquifers can be replenished or has very high levels of desalinization water generation (the conversion of seawater to freshwater using osmosis processes).
What share of freshwater resources do we use?
The visualization provides a measure of levels of water stress across the world. This is measured based on freshwater withdrawals as a share of internal (renewable) resources. The Food and Agriculture Organization of the United Nations categorizes water stress in the following ways: if withdrawals are less than 25 percent of resources, then a country has no water stress; 25-50 percent is low stress; 50-75 percent is medium; 75-100 percent high stress; and greater than 100 percent is critical stress.3
Several countries across the Middle East & North Africa have extremely high levels of water stress. Many have withdrawal rates well in excess of 100 percent — this means they are either extracting unsustainably from existing aquifer sources or producing a large share of water from desalinization.
Water stress in Northern Europe, Canada, much of Latin America, Sub-Saharan Africa, and Oceania is typically low or low to medium.
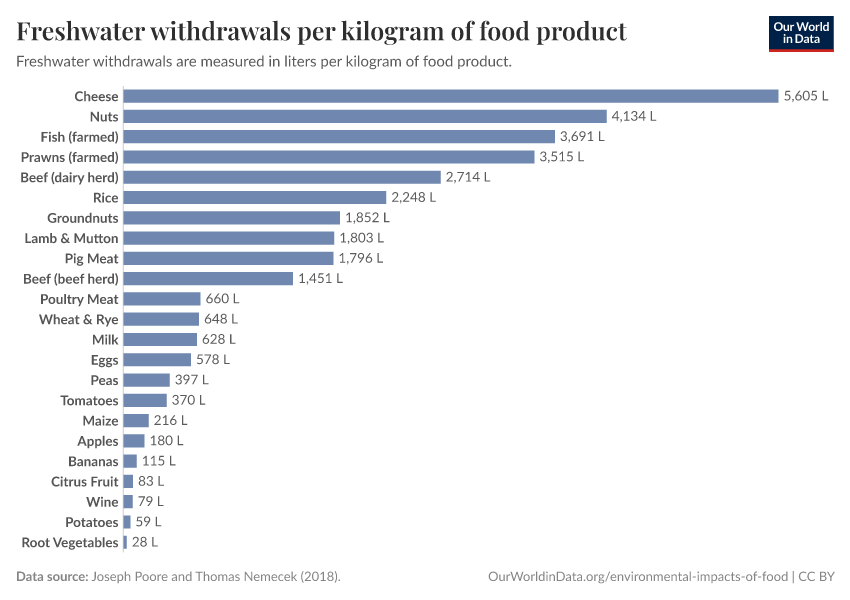
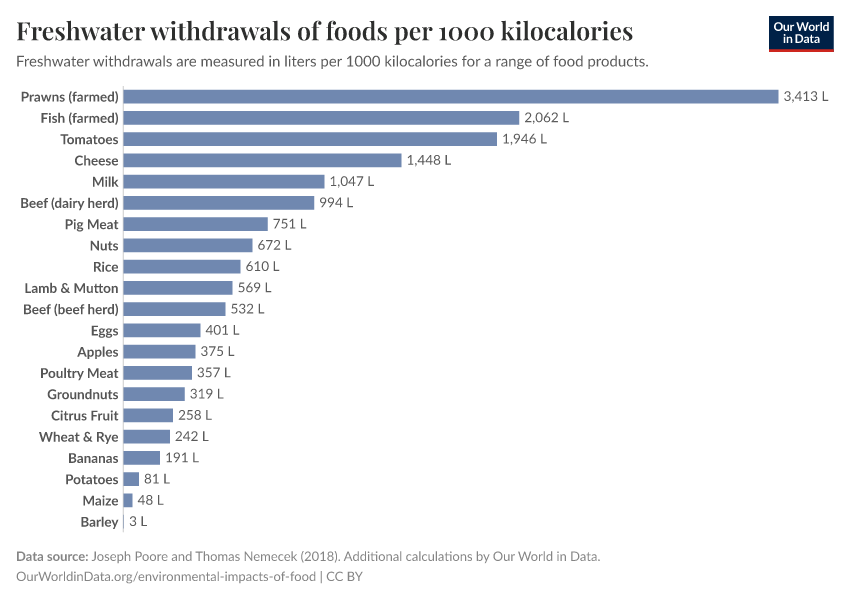
Water use of food products
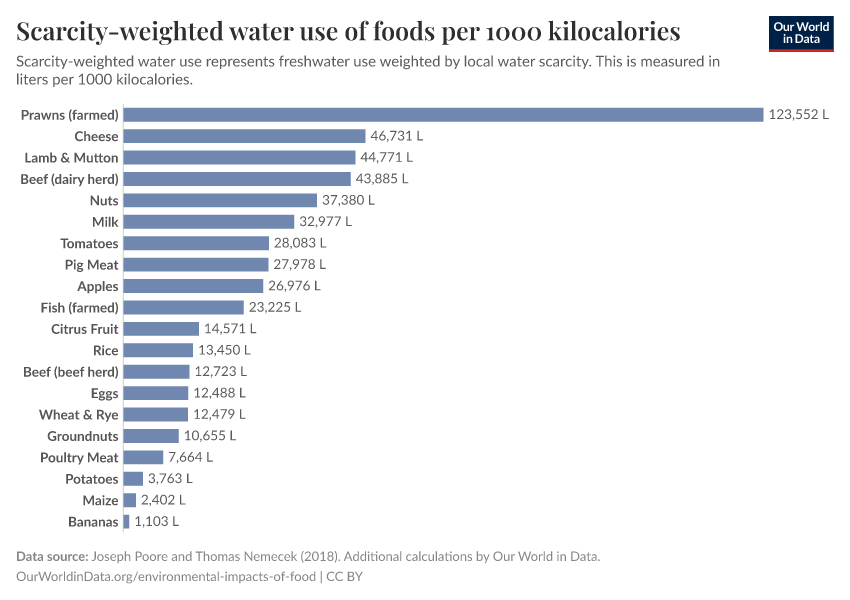
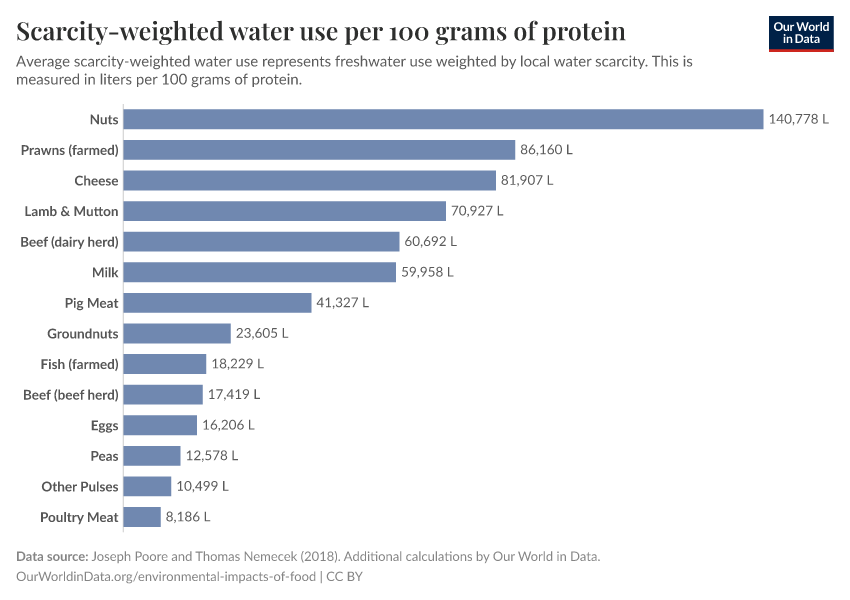
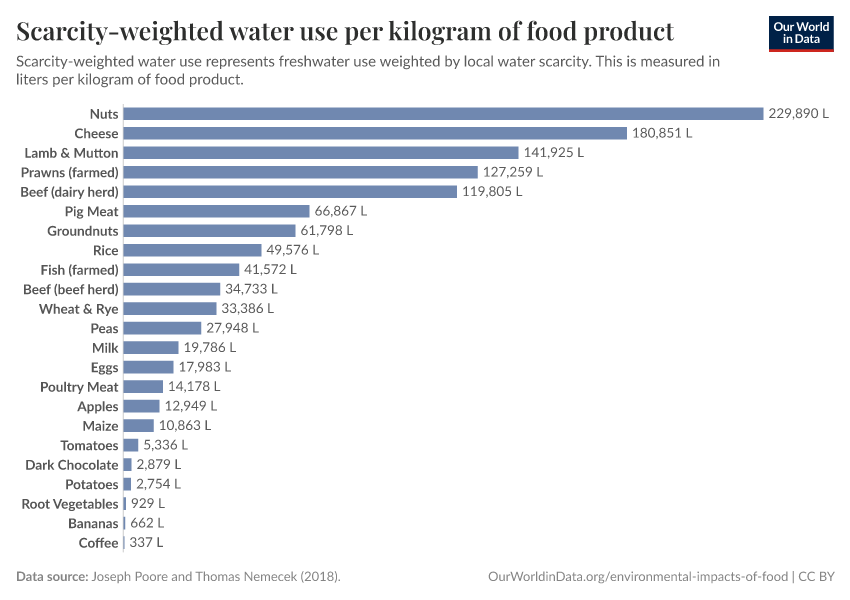
Globally, 70 percent of freshwater withdrawals are used for agriculture. However, water requirements vary significantly depending on food type. The charts show the global average freshwater withdrawals in liters per kilogram of food product, per 1000 kilocalories, and 100 grams of protein.
Freshwater withdrawals per kilogram of food product
Freshwater withdrawals per 1000 kilocalories
Freshwater withdrawals per 100 grams of protein
Definitions
Water withdrawals
Water withdrawal: Water withdrawals (also sometimes known as 'water abstractions') are defined as freshwater taken from ground or surface water sources (such as rivers or lakes), either permanently or temporarily, and used for agricultural, industrial, or municipal (domestic) uses.
The UN Food and Agricultural Organization (FAO) AQUASTAT Database defines total water withdrawal as: "Annual quantity of water withdrawn for agricultural, industrial and municipal purposes. It can include water from primary renewable and secondary freshwater resources, as well as water from over-abstraction of renewable groundwater or withdrawal from fossil groundwater, direct use of agricultural drainage water, direct use of (treated) wastewater, and desalinated water. It does not include in-stream uses, which are characterized by a very low net consumption rate, such as recreation, navigation, hydropower, inland capture fisheries, etc."
Total withdrawal is equal to: [withdrawals for agriculture] + [withdrawals for industry] + [withdrawals for municipal/domestic uses].
The UN Food and Agricultural Organization (FAO) AQUASTAT Database gives the following definitions for agricultural, industrial, and municipal withdrawals:
Agricultural water withdrawal: "Annual quantity of self-supplied water withdrawn for irrigation, livestock and aquaculture purposes. It can include water from primary renewable and secondary freshwater resources, as well as water from over-abstraction of renewable groundwater or withdrawal from fossil groundwater, direct use of agricultural drainage water, direct use of (treated) wastewater, and desalinated water. Water for the dairy and meat industries and industrial processing of harvested agricultural products is included under industrial water withdrawal."
Industrial water withdrawal: "Annual quantity of self-supplied water withdrawn for industrial uses. It can include water from primary renewable and secondary freshwater resources, as well as water from over-abstraction of renewable groundwater or withdrawal from fossil groundwater, direct use of agricultural drainage water, direct use of (treated) wastewater, and desalinated water. This sector refers to self-supplied industries not connected to the public distribution network. The ratio between net consumption and withdrawal is estimated at less than 5%. It includes water for the cooling of thermoelectric and nuclear power plants, but it does not include hydropower. Water withdrawn by industries that are connected to the public supply network is generally included in municipal water withdrawal."
Municipal water withdrawal: "Annual quantity of water withdrawn primarily for the direct use by the population. It can include water from primary renewable and secondary freshwater resources, as well as water from over-abstraction of renewable groundwater or withdrawal from fossil groundwater, direct use of agricultural drainage water, direct use of (treated) wastewater, and desalinated water. It is usually computed as the total water withdrawn by the public distribution network. It can include part of the industries and urban agriculture, which is connected to the municipal network. The ratio between the net consumption and the water withdrawn can vary from 5 to 15% in urban areas and 10 to 50% in rural areas."
Water stress levels
Renewable internal freshwater resources refer to the quantity of internal freshwater from inflowing river basins and recharging groundwater aquifers. Data on renewable resources should be treated with caution; since this data is gathered intermittently, it fails to capture seasonal and annual variance in water resources, which can be significant in some nations. Data at a national level also fails to capture variability at more local levels, which can be important when analyzing the sustainability of particular groundwater aquifers or surface water basins.
Water stress is defined in its simplest terms as occurring when total freshwater withdrawal substantiates a large share of available renewable freshwater resources.
UN-Water defines water stress categories based on this percentage (% of withdrawals to renewable resources) as follows:
- <25% = no stress
- 25-50% = low stress
- 50-75% = medium stress
- 75-100% = high stress
- >100% = critical stress
Key Charts on Water Use & Stress
See all charts on this topicEndnotes
Gleick,P.H et al. (2014). The World's Water: The Biennial Report on Freshwater Resources. Washington, DC: Island Press). Available online.
World Bank (2008) – World Development Report (2008): Agriculture for Development. Washington, DC: World Bank. Available online.
FAO and UN Water. 2021. Progress on Level of Water Stress. Global status and acceleration needs for SDG
Indicator 6.4.2, 2021. Rome. https://doi.org/10.4060/cb6241en
Cite this work
Our articles and data visualizations rely on work from many different people and organizations. When citing this topic page, please also cite the underlying data sources. This topic page can be cited as:
Hannah Ritchie and Max Roser (2018) - “Water Use and Stress” Published online at OurWorldinData.org. Retrieved from: 'https://ourworldindata.org/water-use-stress' [Online Resource]BibTeX citation
@article{owid-water-use-stress,
    author = {Hannah Ritchie and Max Roser},
    title = {Water Use and Stress},
    journal = {Our World in Data},
    year = {2018},
    note = {https://ourworldindata.org/water-use-stress}
}
Reuse this work freely
All visualizations, data, and code produced by Our World in Data are completely open access under the Creative Commons BY license. You have the permission to use, distribute, and reproduce these in any medium, provided the source and authors are credited.
The data produced by third parties and made available by Our World in Data is subject to the license terms from the original third-party authors. We will always indicate the original source of the data in our documentation, so you should always check the license of any such third-party data before use and redistribution.
All of our charts can be embedded in any site.


