Cardiovascular Diseases
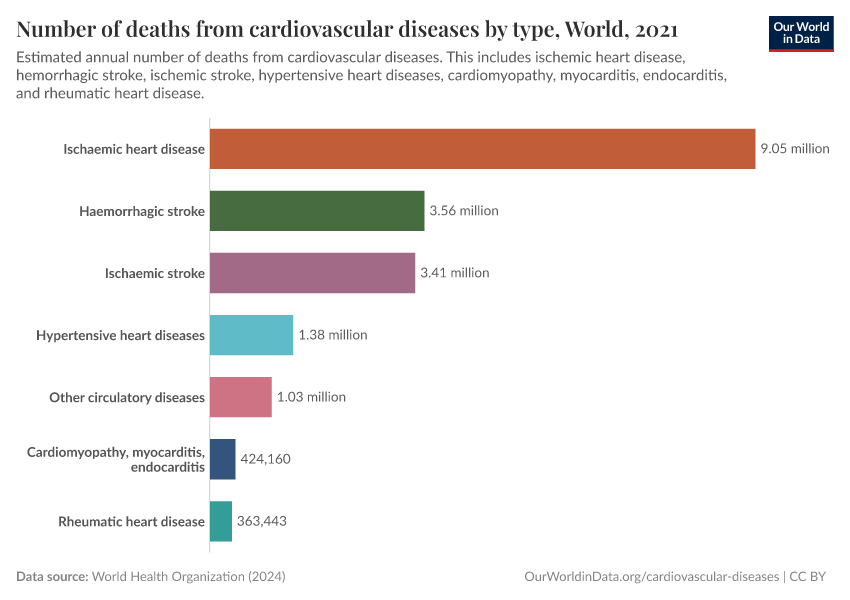
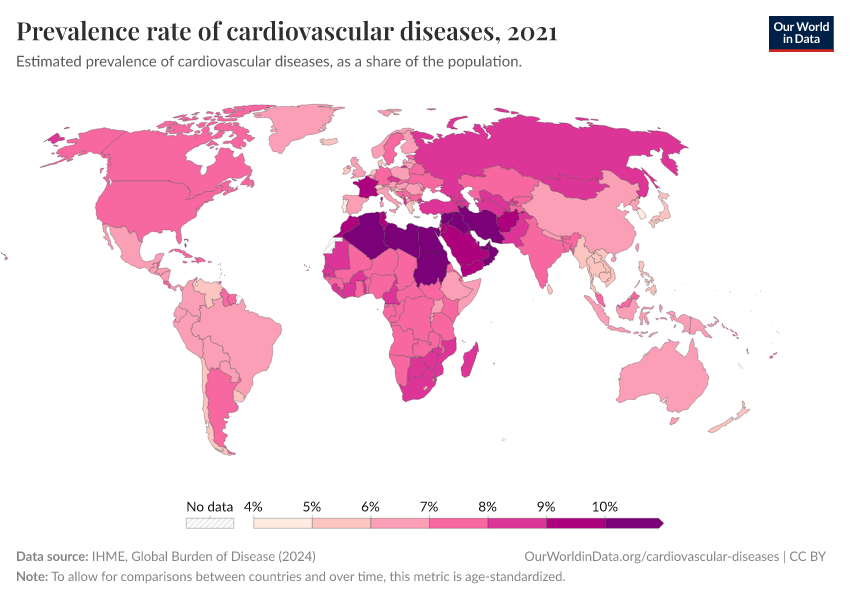
Cardiovascular diseases cover all diseases of the heart and blood vessels – including heart attacks and strokes, atherosclerosis, ischemic heart disease, hypertensive diseases, cardiomyopathy, and others.
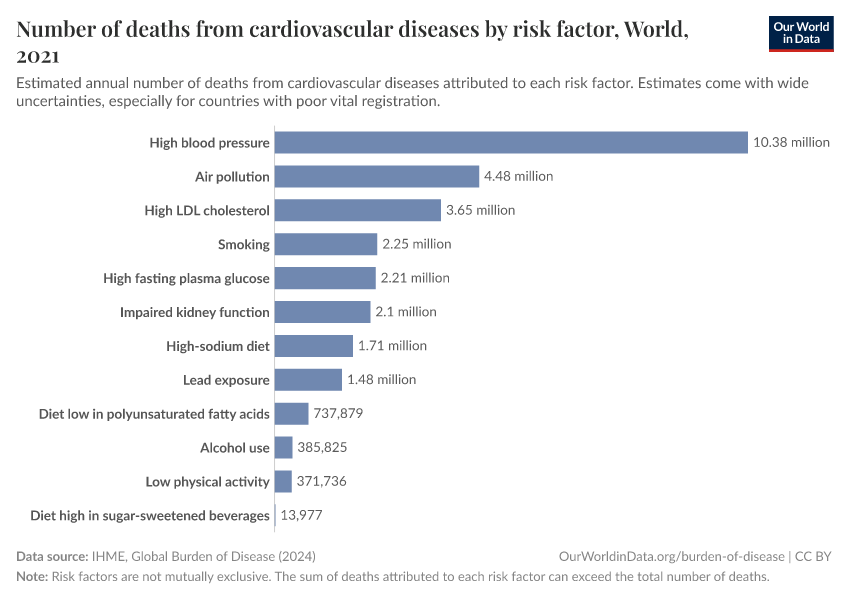
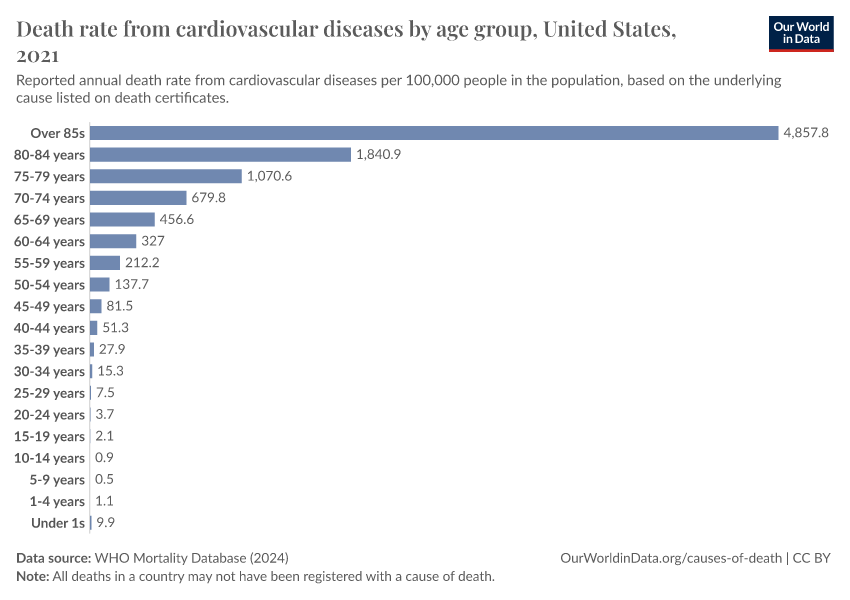
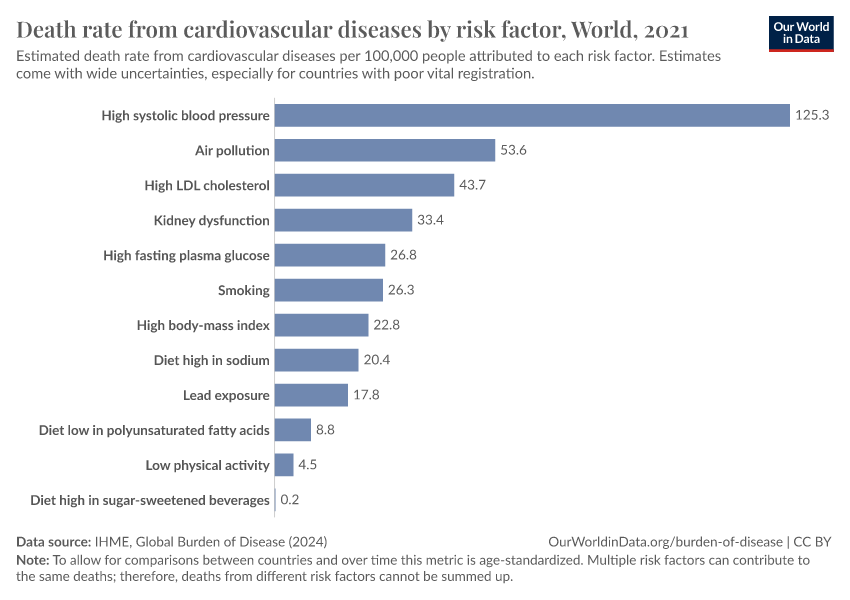
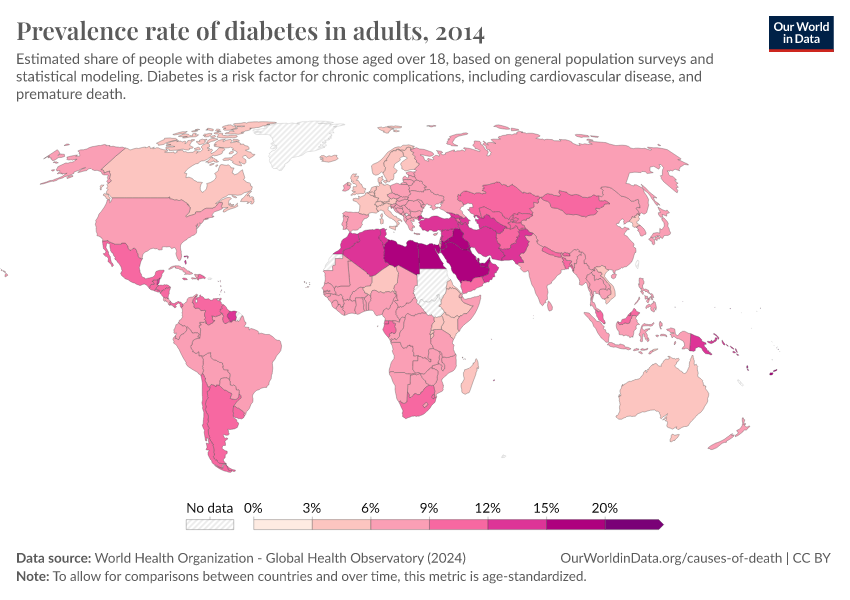
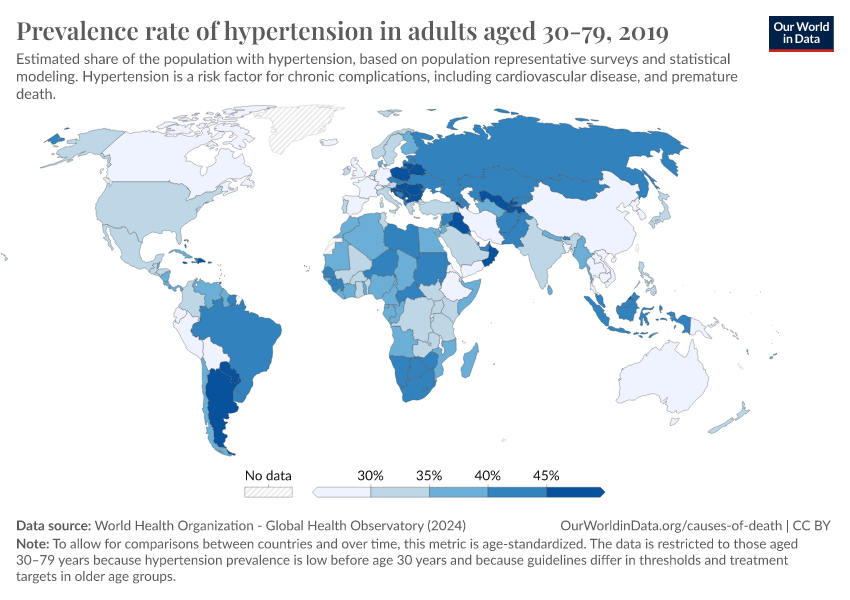
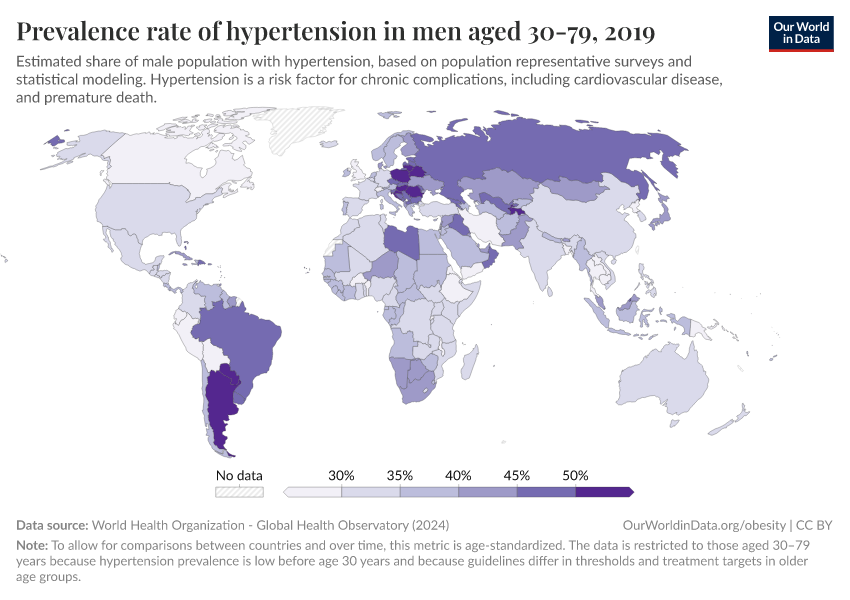
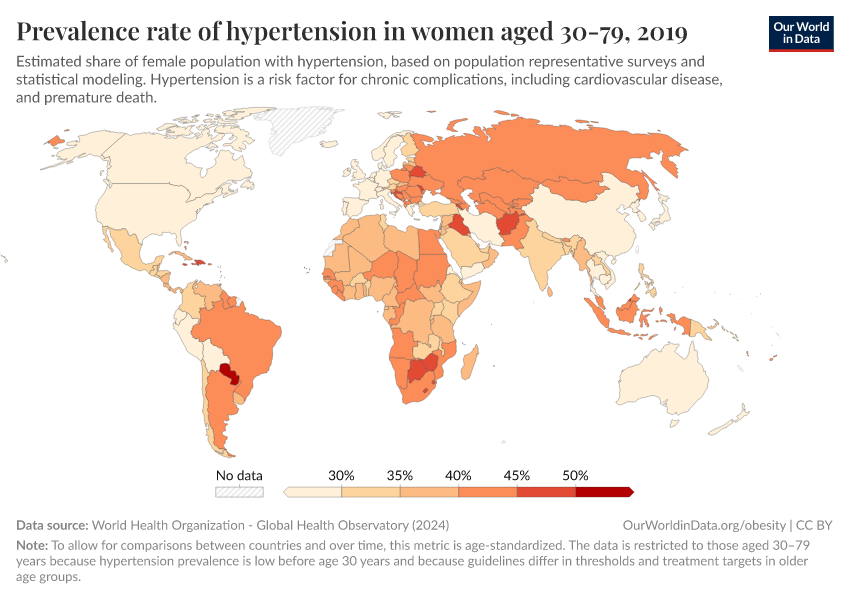
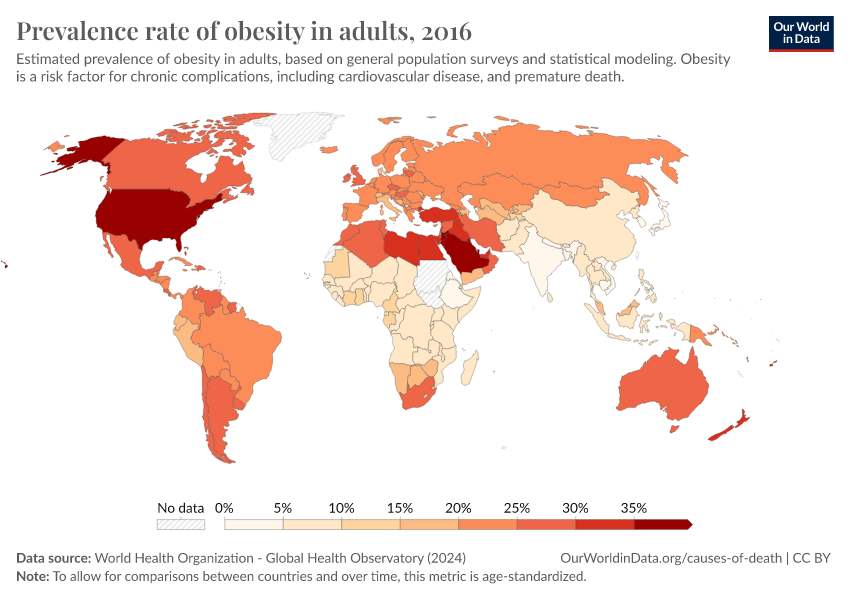
These diseases tend to develop gradually with age, especially when people have risk factors like high blood pressure, smoking, alcohol use, poor diet, and air pollution.
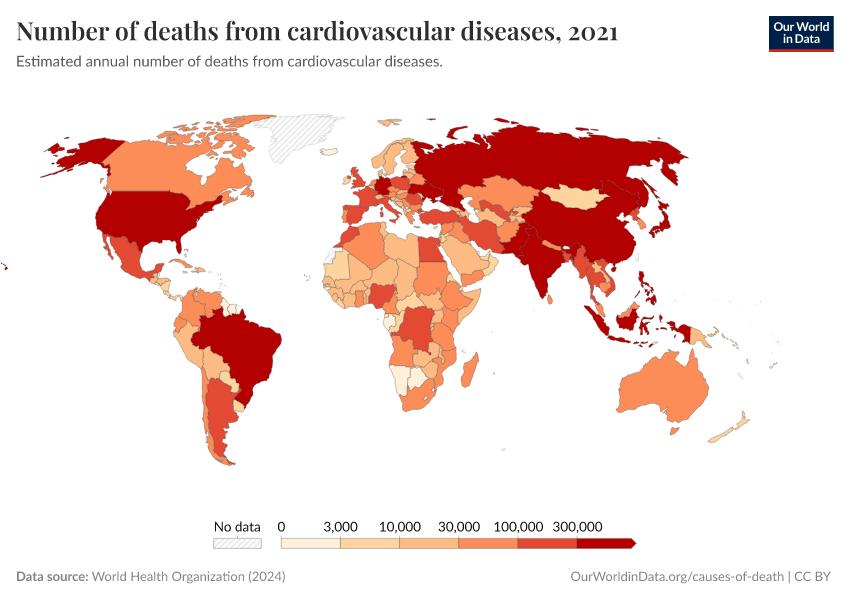
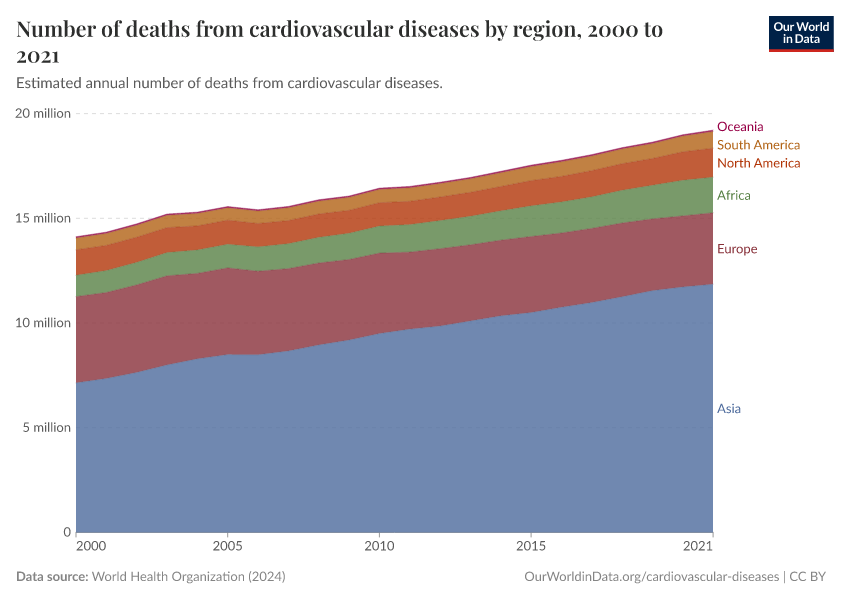
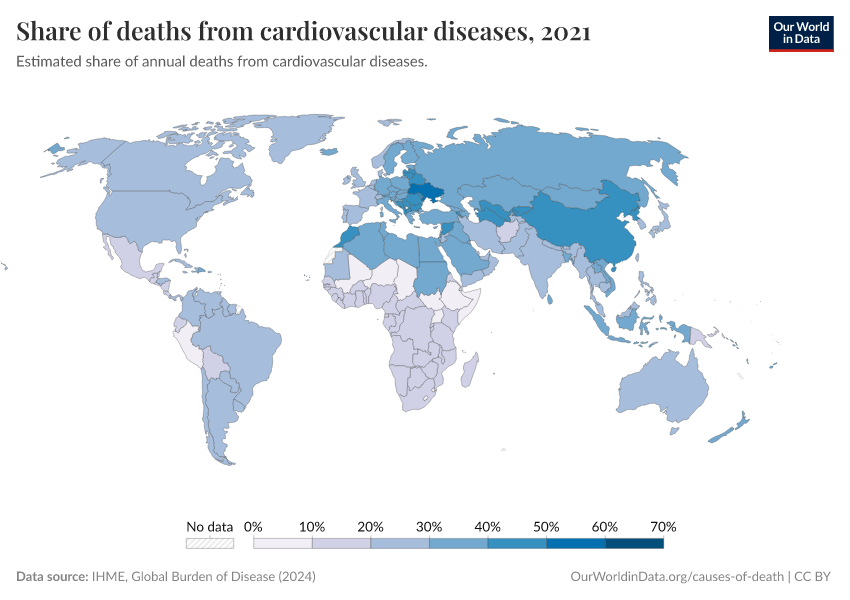
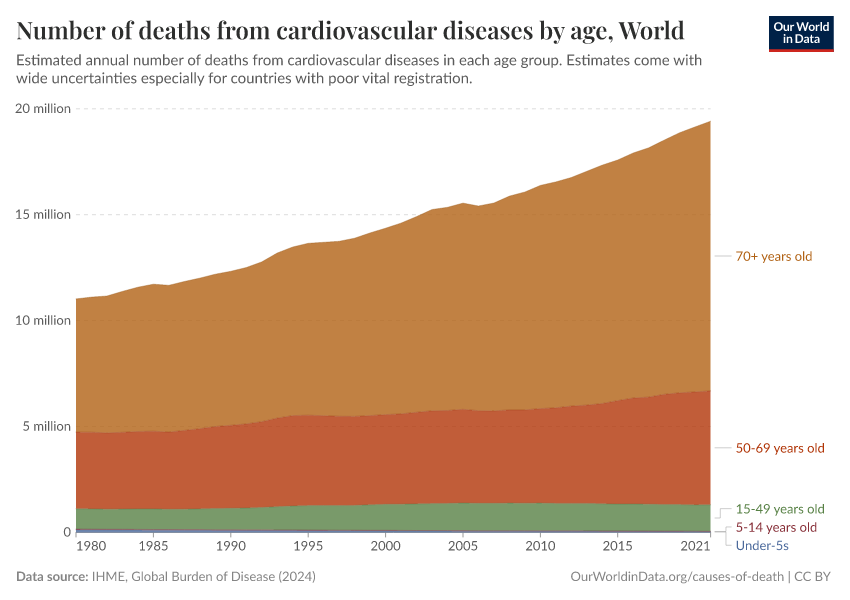
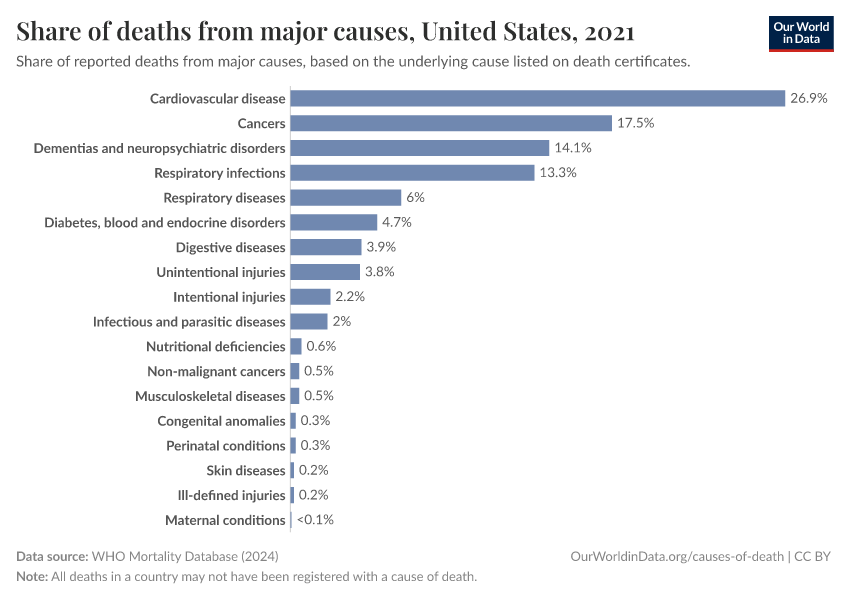
Together, cardiovascular diseases are the most common cause of death globally.
In 2000, around 14 million people died from cardiovascular diseases globally, while in 2019, close to 18 million died.
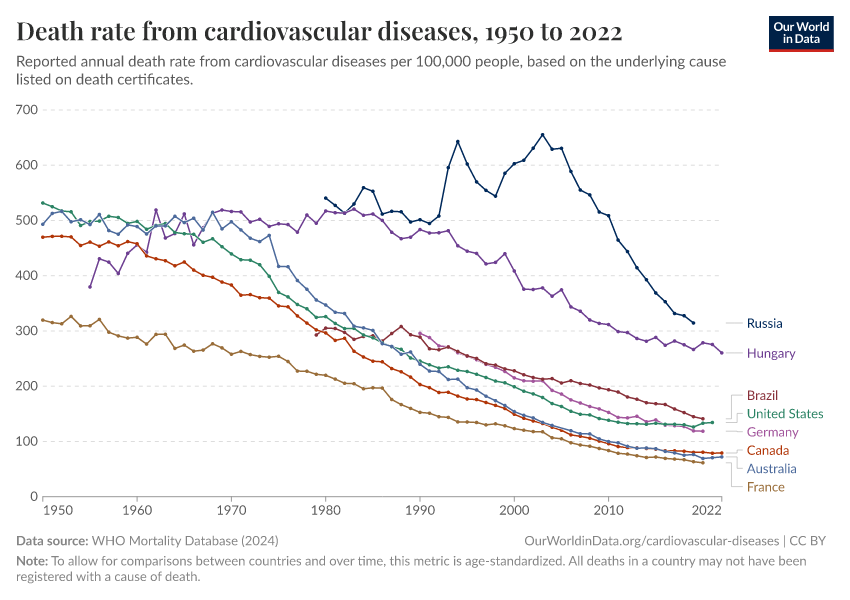
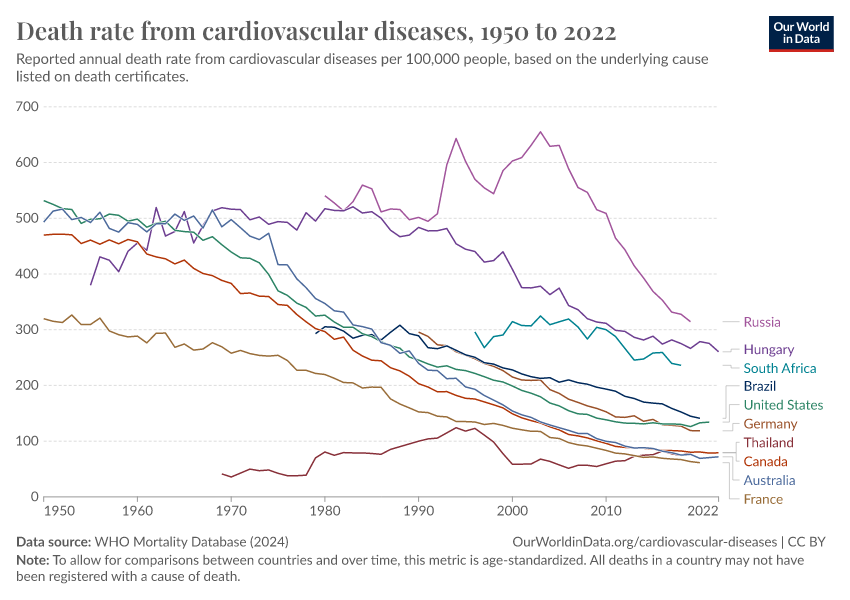
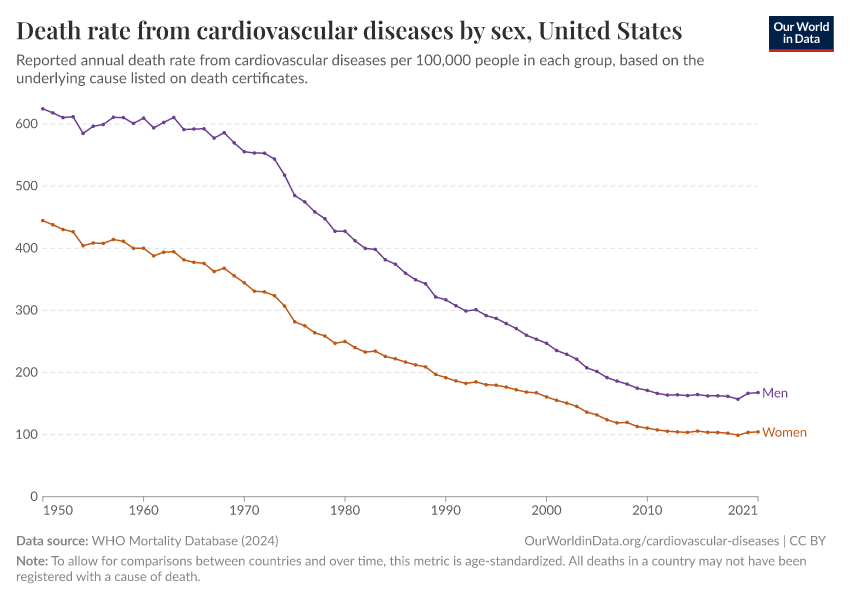
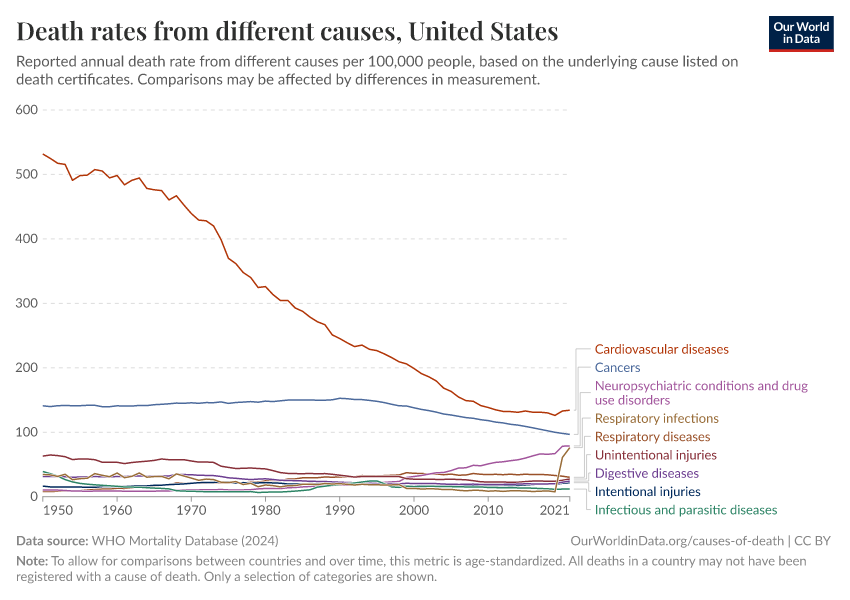
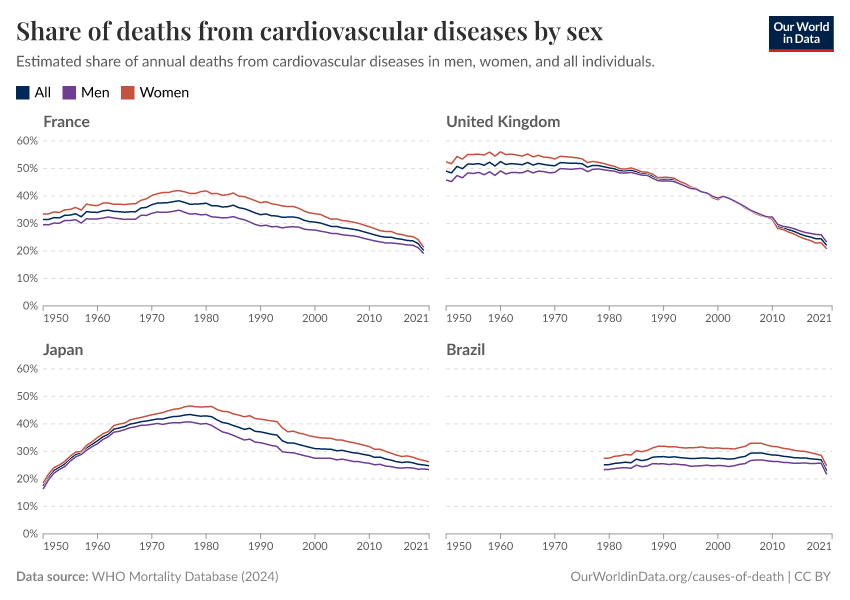
The rising death toll is largely due to a growing and aging global population. Death rates from cardiovascular diseases have actually fallen in many countries – as our ability to prevent and treat them has improved.
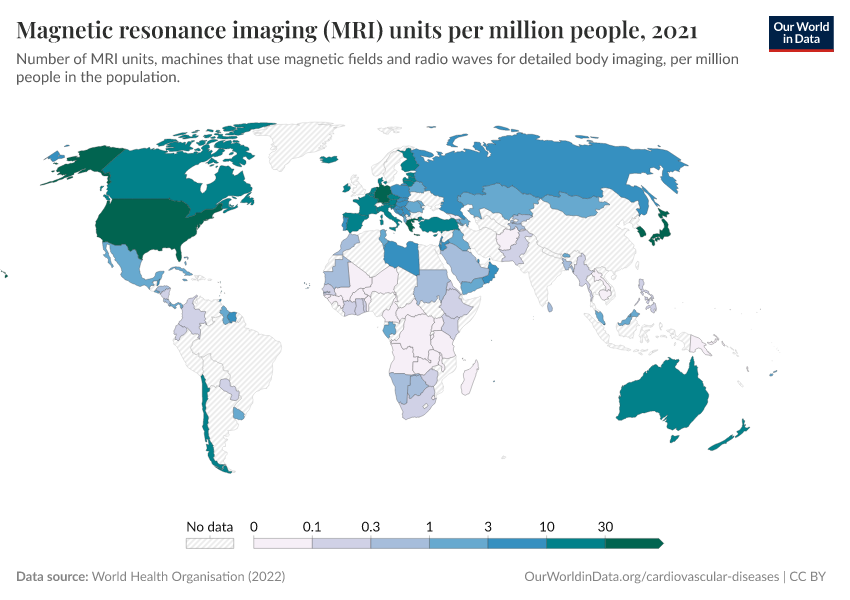
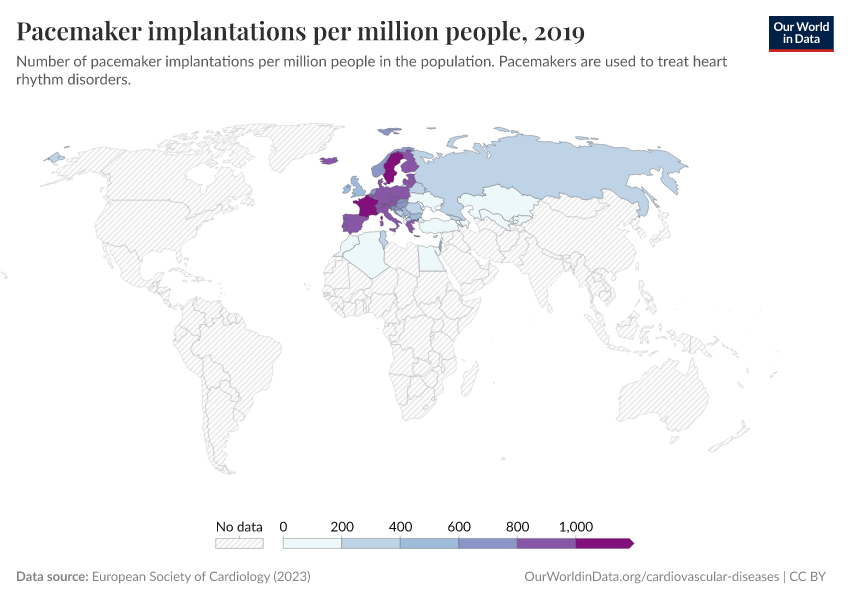
Large declines in smoking; improvements in screening, diagnosis, and monitoring; and advances in medical treatments, public health initiatives, emergency care, and surgical procedures, have all helped to reduce the impact of cardiovascular diseases on people’s lives.
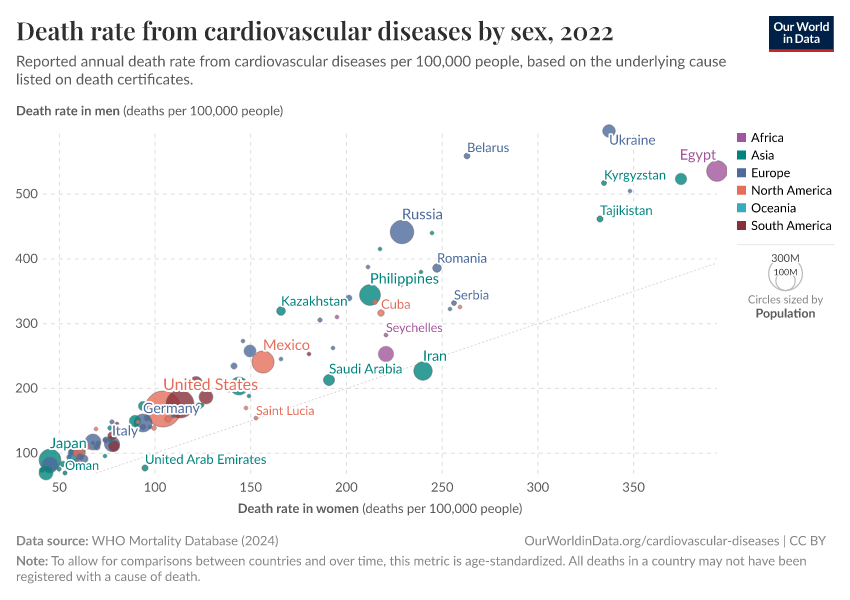
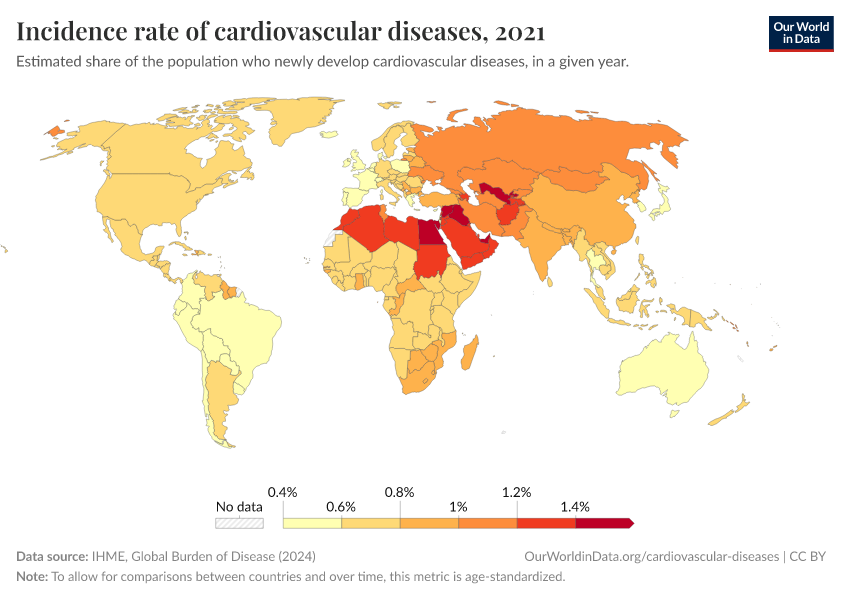
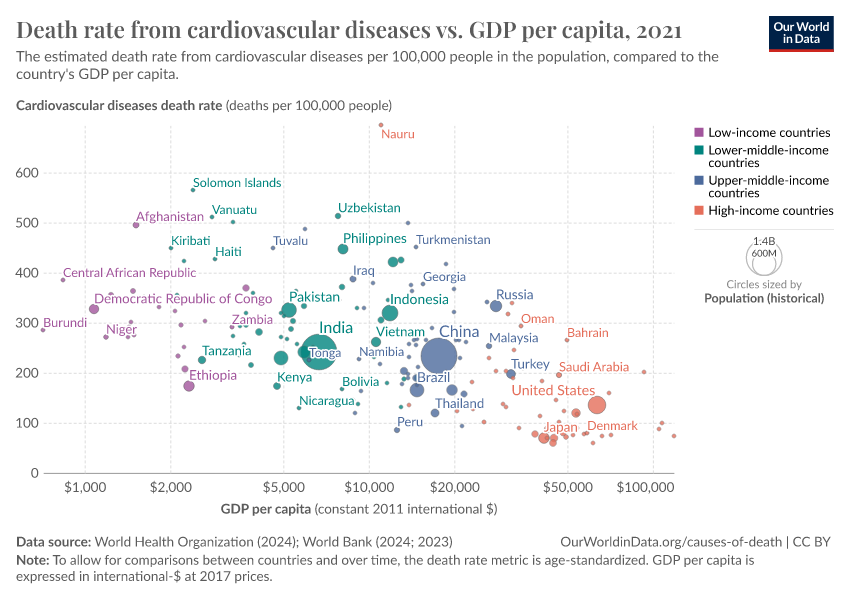
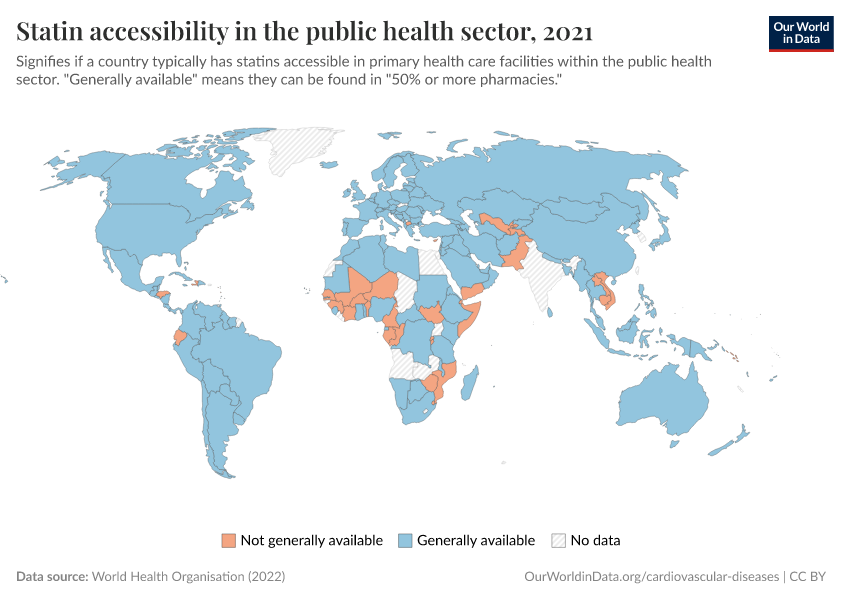
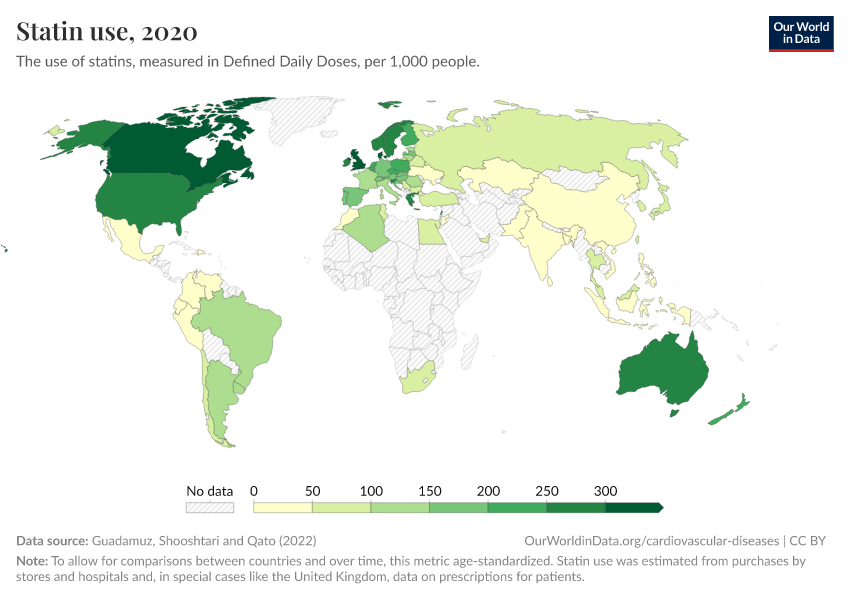
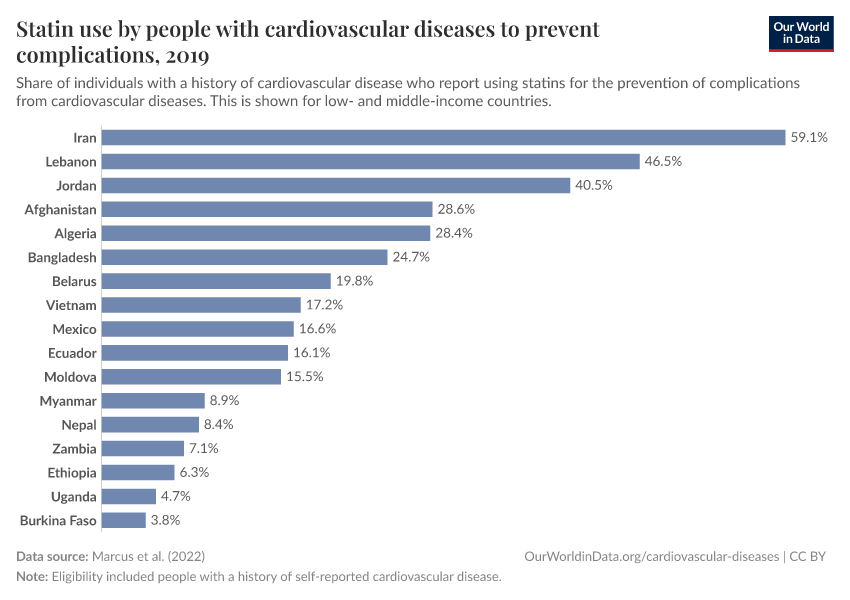
Yet large disparities remain globally. The impact of cardiovascular diseases can be reduced much further with greater understanding and public health efforts.
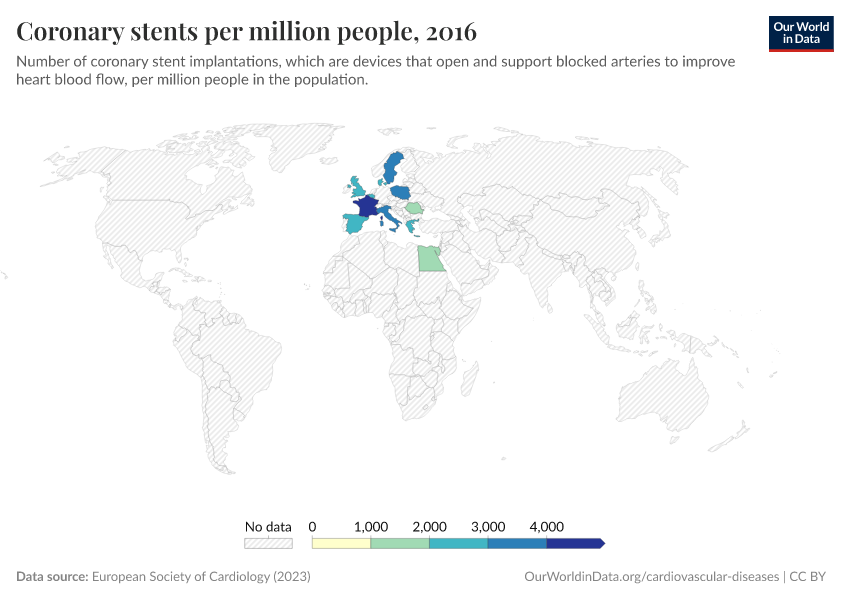
On this page, you will find global data on cardiovascular diseases, their risk factors and treatments, and their trends over time.
Key Charts on Cardiovascular Diseases
See all charts on this topicEndnotes
Although communicable and non-communicable diseases are shown separately, it is now understood that infectious diseases contribute to several non-communicable diseases.
This includes Helicobacter pylori and stomach cancer, human papillomavirus and cervical cancer, hepatitis C virus, and liver cancer, Chlamydia pneumoniae and atherosclerosis, Streptococcus pneumoniae and chronic respiratory diseases, and others.
In addition, infectious diseases can increase the risk of dying from non-communicable diseases. For example, several respiratory pathogens, such as the influenza virus, increase the risk of heart attacks and strokes.
Mercer, A. J. (2018). Updating the epidemiological transition model. Epidemiology and Infection, 146(6), 680–687. https://doi.org/10.1017/S0950268818000572
Behrouzi, B., Bhatt, D. L., Cannon, C. P., Vardeny, O., Lee, D. S., Solomon, S. D., & Udell, J. A. (2022). Association of Influenza Vaccination With Cardiovascular Risk: A Meta-analysis. JAMA Network Open, 5(4), e228873. https://doi.org/10.1001/jamanetworkopen.2022.8873
Jagannathan, R., Patel, S. A., Ali, M. K., & Narayan, K. M. V. (2019). Global Updates on Cardiovascular Disease Mortality Trends and Attribution of Traditional Risk Factors. Current Diabetes Reports, 19(7), 44. https://doi.org/10.1007/s11892-019-1161-2
Joseph, P., Leong, D., McKee, M., Anand, S. S., Schwalm, J.-D., Teo, K., Mente, A., & Yusuf, S. (2017). Reducing the Global Burden of Cardiovascular Disease, Part 1: The Epidemiology and Risk Factors. Circulation Research, 121(6), 677–694. https://doi.org/10.1161/CIRCRESAHA.117.308903
Roth, G. A., Forouzanfar, M. H., Moran, A. E., Barber, R., Nguyen, G., Feigin, V. L., Naghavi, M., Mensah, G. A., & Murray, C. J. L. (2015). Demographic and Epidemiologic Drivers of Global Cardiovascular Mortality. New England Journal of Medicine, 372(14), 1333–1341. https://doi.org/10.1056/NEJMoa1406656
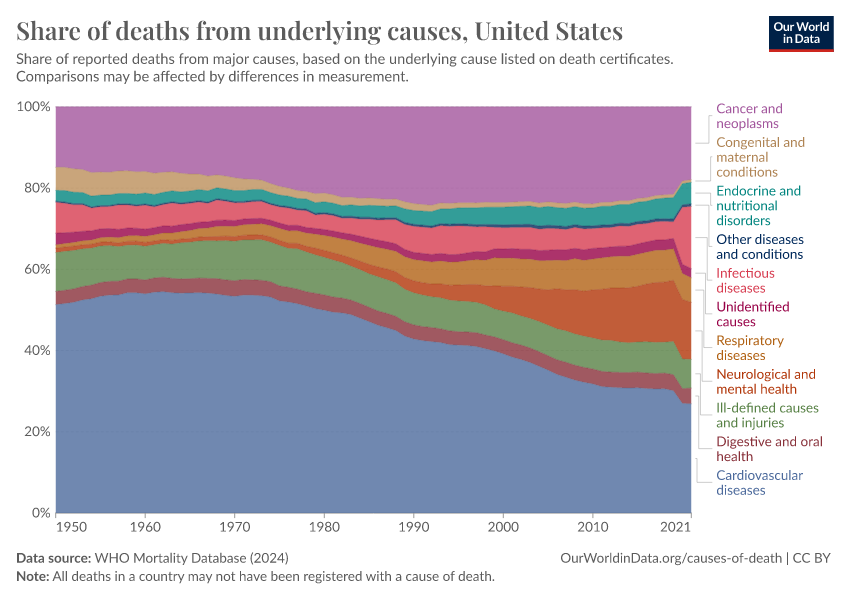
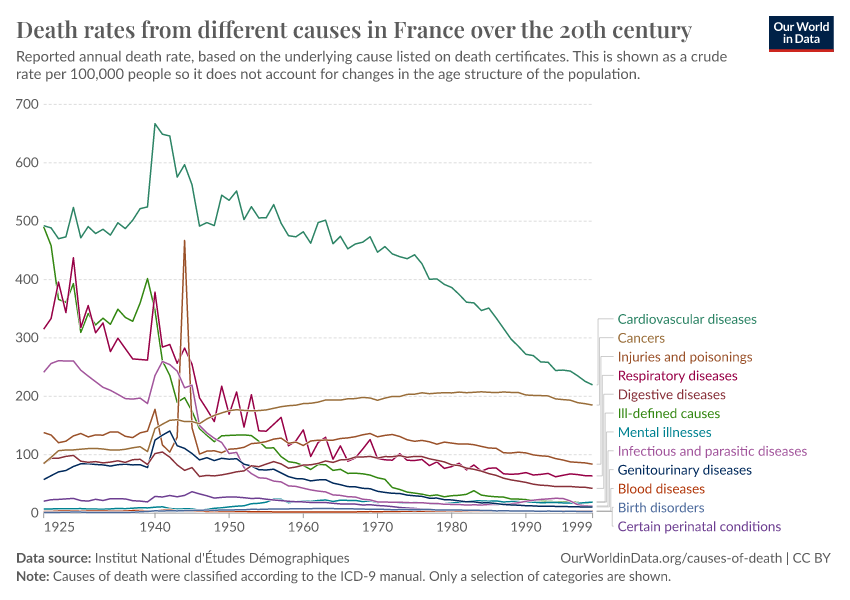
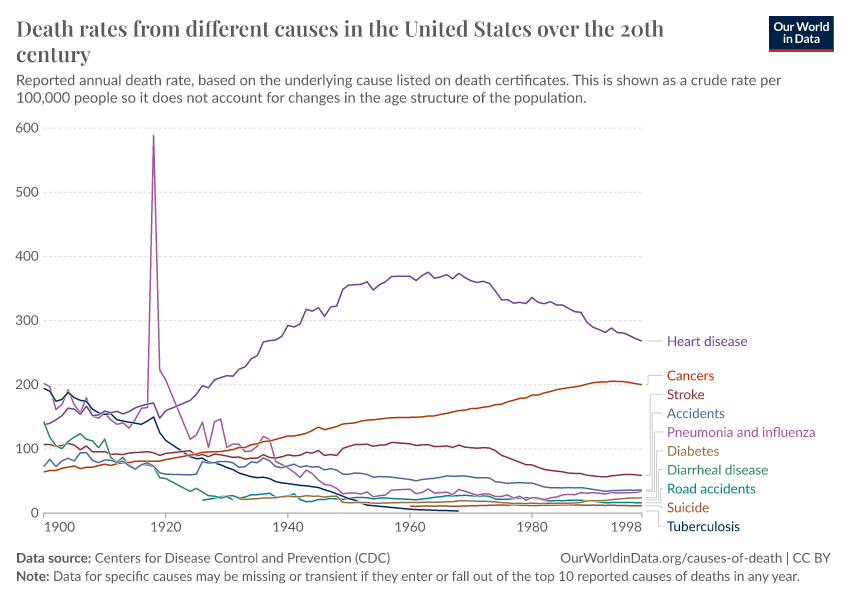
In these related charts, you can see trends in crude death rates from different causes over the twentieth century in France and the United States.
The decline in smoking has a much quicker effect in alleviating the risks of cardiovascular diseases than of lung cancers and other cancers.
Oza, S., Thun, M. J., Henley, S. J., Lopez, A. D., & Ezzati, M. (2011). How many deaths are attributable to smoking in the United States? Comparison of methods for estimating smoking-attributable mortality when smoking prevalence changes. Preventive Medicine, 52(6), 428–433. https://doi.org/10.1016/j.ypmed.2011.04.007
Mensah, G. A., Wei, G. S., Sorlie, P. D., Fine, L. J., Rosenberg, Y., Kaufmann, P. G., Mussolino, M. E., Hsu, L. L., Addou, E., Engelgau, M. M., & Gordon, D. (2017). Decline in Cardiovascular Mortality: Possible Causes and Implications. Circulation Research, 120(2), 366–380. https://doi.org/10.1161/CIRCRESAHA.116.309115
Weisfeldt, M. L., & Zieman, S. J. (2007). Advances In The Prevention And Treatment Of Cardiovascular Disease. Health Affairs, 26(1), 25–37. https://doi.org/10.1377/hlthaff.26.1.25
Gao, Y., Shah, L. M., Ding, J., & Martin, S. S. (2023). US Trends in Cholesterol Screening, Lipid Levels, and Lipid‐Lowering Medication Use in US Adults, 1999 to 2018. Journal of the American Heart Association, 12(3), e028205. https://doi.org/10.1161/JAHA.122.028205
Jagannathan, R., Patel, S. A., Ali, M. K., & Narayan, K. M. V. (2019). Global Updates on Cardiovascular Disease Mortality Trends and Attribution of Traditional Risk Factors. Current Diabetes Reports, 19(7), 44. https://doi.org/10.1007/s11892-019-1161-2
Joseph, P., Leong, D., McKee, M., Anand, S. S., Schwalm, J.-D., Teo, K., Mente, A., & Yusuf, S. (2017). Reducing the Global Burden of Cardiovascular Disease, Part 1: The Epidemiology and Risk Factors. Circulation Research, 121(6), 677–694. https://doi.org/10.1161/CIRCRESAHA.117.308903
Roth, G. A., Forouzanfar, M. H., Moran, A. E., Barber, R., Nguyen, G., Feigin, V. L., Naghavi, M., Mensah, G. A., & Murray, C. J. L. (2015). Demographic and Epidemiologic Drivers of Global Cardiovascular Mortality. New England Journal of Medicine, 372(14), 1333–1341. https://doi.org/10.1056/NEJMoa1406656
Bittner, V. (2020). The New 2019 AHA/ACC Guideline on the Primary Prevention of Cardiovascular Disease. Circulation, 142(25), 2402–2404. https://doi.org/10.1161/CIRCULATIONAHA.119.040625
Jagannathan, R., Patel, S. A., Ali, M. K., & Narayan, K. M. V. (2019). Global Updates on Cardiovascular Disease Mortality Trends and Attribution of Traditional Risk Factors. Current Diabetes Reports, 19(7), 44. https://doi.org/10.1007/s11892-019-1161-2
Kaptoge, S., Pennells, L., De Bacquer, D., Cooney, M. T., Kavousi, M., Stevens, G., Riley, L. M., Savin, S., Khan, T., Altay, S., Amouyel, P., Assmann, G., Bell, S., Ben-Shlomo, Y., Berkman, L., Beulens, J. W., Björkelund, C., Blaha, M., Blazer, D. G., … Di Angelantonio, E. (2019). World Health Organization cardiovascular disease risk charts: Revised models to estimate risk in 21 global regions. The Lancet Global Health, 7(10), e1332–e1345. https://doi.org/10.1016/S2214-109X(19)30318-3
Cosselman, K. E., Navas-Acien, A., & Kaufman, J. D. (2015). Environmental factors in cardiovascular disease. Nature Reviews Cardiology, 12(11), 627–642. https://doi.org/10.1038/nrcardio.2015.152
Newby, D. E., Mannucci, P. M., Tell, G. S., Baccarelli, A. A., Brook, R. D., Donaldson, K., Forastiere, F., Franchini, M., Franco, O. H., Graham, I., Hoek, G., Hoffmann, B., Hoylaerts, M. F., Künzli, N., Mills, N., Pekkanen, J., Peters, A., Piepoli, M. F., Rajagopalan, S., & Storey, R. F. (2015). Expert position paper on air pollution and cardiovascular disease. European Heart Journal, 36(2), 83–93. https://doi.org/10.1093/eurheartj/ehu458
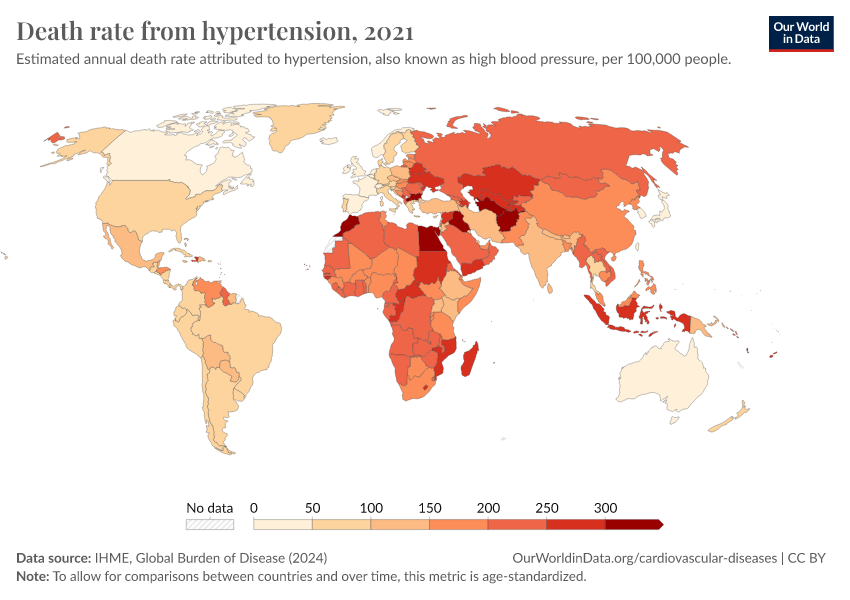
This death toll is a population-attributable number, which means it is an estimate of the number of deaths that would be prevented if hypertension was absent in the entire population.
Cite this work
Our articles and data visualizations rely on work from many different people and organizations. When citing this topic page, please also cite the underlying data sources. This topic page can be cited as:
Saloni Dattani, Veronika Samborska, Hannah Ritchie, and Max Roser (2023) - “Cardiovascular Diseases” Published online at OurWorldinData.org. Retrieved from: 'https://ourworldindata.org/cardiovascular-diseases' [Online Resource]BibTeX citation
@article{owid-cardiovascular-diseases,
    author = {Saloni Dattani and Veronika Samborska and Hannah Ritchie and Max Roser},
    title = {Cardiovascular Diseases},
    journal = {Our World in Data},
    year = {2023},
    note = {https://ourworldindata.org/cardiovascular-diseases}
}
Reuse this work freely
All visualizations, data, and code produced by Our World in Data are completely open access under the Creative Commons BY license. You have the permission to use, distribute, and reproduce these in any medium, provided the source and authors are credited.
The data produced by third parties and made available by Our World in Data is subject to the license terms from the original third-party authors. We will always indicate the original source of the data in our documentation, so you should always check the license of any such third-party data before use and redistribution.
All of our charts can be embedded in any site.

